

256
10 Applications: Organic Interfaces
x
1
0
0.2
0.4
0.6
0.8
CH
3 s.s. amplitude
(a)
(b)
x P(cos ) distribution
cos
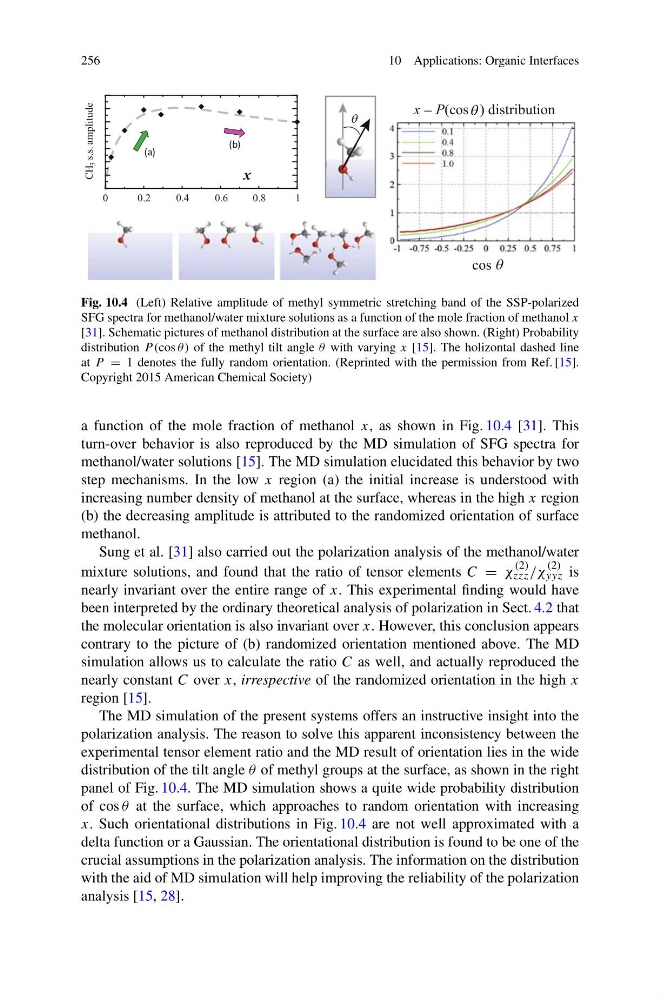
Fig. 10.4 (Left) Relative amplitude of methyl symmetric stretching band of the SSP-polarized
SFG spectra for methanol/water mixture solutions as a function of the mole fraction of methanol x
[31]. Schematic pictures of methanol distribution at the surface are also shown. (Right) Probability
distribution P (cos θ) of the methyl tilt angle θ with varying x [15]. The holizontal dashed line
at P = 1 denotes the fully random orientation. (Reprinted with the permission from Ref. [15].
Copyright 2015 American Chemical Society)
a function of the mole fraction of methanol x, as shown in Fig. 10.4 [31]. This
turn-over behavior is also reproduced by the MD simulation of SFG spectra for
methanol/water solutions [15]. The MD simulation elucidated this behavior by two
step mechanisms. In the low x region (a) the initial increase is understood with
increasing number density of methanol at the surface, whereas in the high x region
(b) the decreasing amplitude is attributed to the randomized orientation of surface
methanol.
Sung et al. [31] also carried out the polarization analysis of the methanol/water
mixture solutions, and found that the ratio of tensor elements C = χ
(2)
zzz /χ
(2)
yyz is
nearly invariant over the entire range of x. This experimental finding would have
been interpreted by the ordinary theoretical analysis of polarization in Sect. 4.2 that
the molecular orientation is also invariant over x. However, this conclusion appears
contrary to the picture of (b) randomized orientation mentioned above. The MD
simulation allows us to calculate the ratio C as well, and actually reproduced the
nearly constant C over x, irrespective of the randomized orientation in the high x
region [15].
The MD simulation of the present systems offers an instructive insight into the
polarization analysis. The reason to solve this apparent inconsistency between the
experimental tensor element ratio and the MD result of orientation lies in the wide
distribution of the tilt angle θ of methyl groups at the surface, as shown in the right
panel of Fig. 10.4. The MD simulation shows a quite wide probability distribution
of cos θ at the surface, which approaches to random orientation with increasing
x. Such orientational distributions in Fig. 10.4 are not well approximated with a
delta function or a Gaussian. The orientational distribution is found to be one of the
crucial assumptions in the polarization analysis. The information on the distribution
with the aid of MD simulation will help improving the reliability of the polarization
analysis [15, 28].
10 Applications: Organic Interfaces
x
1
0
0.2
0.4
0.6
0.8
CH
3 s.s. amplitude
(a)
(b)
x P(cos ) distribution
cos
Fig. 10.4 (Left) Relative amplitude of methyl symmetric stretching band of the SSP-polarized
SFG spectra for methanol/water mixture solutions as a function of the mole fraction of methanol x
[31]. Schematic pictures of methanol distribution at the surface are also shown. (Right) Probability
distribution P (cos θ) of the methyl tilt angle θ with varying x [15]. The holizontal dashed line
at P = 1 denotes the fully random orientation. (Reprinted with the permission from Ref. [15].
Copyright 2015 American Chemical Society)
a function of the mole fraction of methanol x, as shown in Fig. 10.4 [31]. This
turn-over behavior is also reproduced by the MD simulation of SFG spectra for
methanol/water solutions [15]. The MD simulation elucidated this behavior by two
step mechanisms. In the low x region (a) the initial increase is understood with
increasing number density of methanol at the surface, whereas in the high x region
(b) the decreasing amplitude is attributed to the randomized orientation of surface
methanol.
Sung et al. [31] also carried out the polarization analysis of the methanol/water
mixture solutions, and found that the ratio of tensor elements C = χ
(2)
zzz /χ
(2)
yyz is
nearly invariant over the entire range of x. This experimental finding would have
been interpreted by the ordinary theoretical analysis of polarization in Sect. 4.2 that
the molecular orientation is also invariant over x. However, this conclusion appears
contrary to the picture of (b) randomized orientation mentioned above. The MD
simulation allows us to calculate the ratio C as well, and actually reproduced the
nearly constant C over x, irrespective of the randomized orientation in the high x
region [15].
The MD simulation of the present systems offers an instructive insight into the
polarization analysis. The reason to solve this apparent inconsistency between the
experimental tensor element ratio and the MD result of orientation lies in the wide
distribution of the tilt angle θ of methyl groups at the surface, as shown in the right
panel of Fig. 10.4. The MD simulation shows a quite wide probability distribution
of cos θ at the surface, which approaches to random orientation with increasing
x. Such orientational distributions in Fig. 10.4 are not well approximated with a
delta function or a Gaussian. The orientational distribution is found to be one of the
crucial assumptions in the polarization analysis. The information on the distribution
with the aid of MD simulation will help improving the reliability of the polarization
analysis [15, 28].