

238
9 Applications: Aqueous Interfaces
3000
3200
3400
3600
3800
0
0.5
1
1.5
3000
3200
3400
3600
3800
-4
-2
0
2
4
(a) SFG intensity (Exp.)
(b) Im[
] (MD)
(2)
Frequency [cm ]
-1
Frequency [cm ]
-1
CCl4 /water
DCE /water
3000
3200
3400
3600
3800
-4
-2
0
2
4
(d) Im[
] (Free O-H)
(2)
Frequency [cm ]
-1
(c) Free O-H at water/DCE interface
Air /water
CCl4 /water
DCE /water
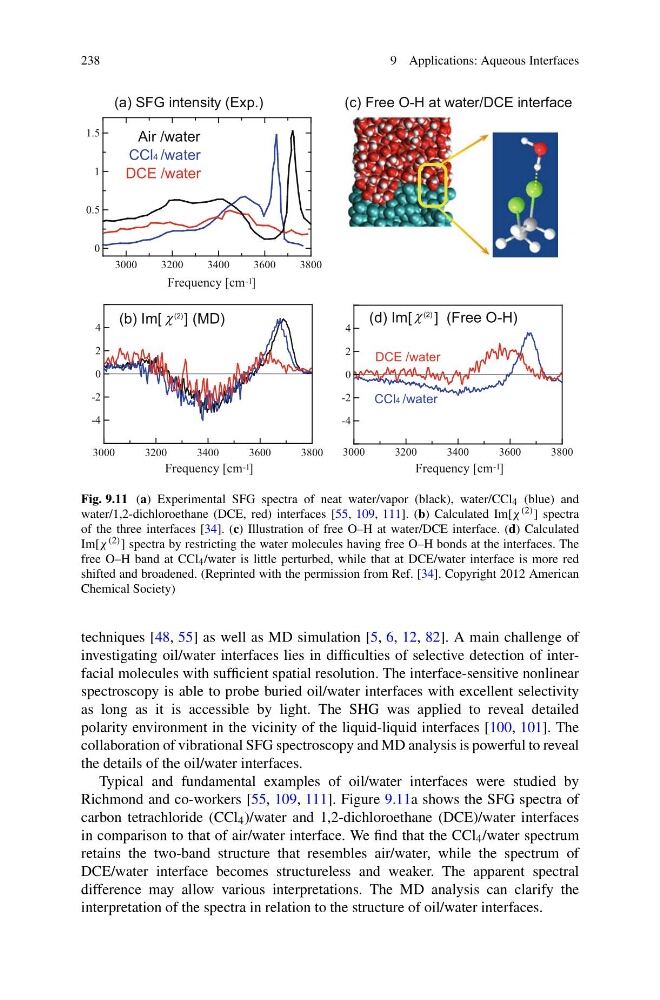
Fig. 9.11 (a) Experimental SFG spectra of neat water/vapor (black), water/CCl 4 (blue) and
water/1,2-dichloroethane (DCE, red) interfaces [55, 109, 111]. (b) Calculated Im[χ (2) ] spectra
of the three interfaces [34]. (c) Illustration of free O–H at water/DCE interface. (d) Calculated
Im[χ (2) ] spectra by restricting the water molecules having free O–H bonds at the interfaces. The
free O–H band at CCl 4 /water is little perturbed, while that at DCE/water interface is more red
shifted and broadened. (Reprinted with the permission from Ref. [34]. Copyright 2012 American
Chemical Society)
techniques [48, 55] as well as MD simulation [5, 6, 12, 82]. A main challenge of
investigating oil/water interfaces lies in difficulties of selective detection of interfacial molecules with sufficient spatial resolution. The interface-sensitive nonlinear
spectroscopy is able to probe buried oil/water interfaces with excellent selectivity
as long as it is accessible by light. The SHG was applied to reveal detailed
polarity environment in the vicinity of the liquid-liquid interfaces [100, 101]. The
collaboration of vibrational SFG spectroscopy and MD analysis is powerful to reveal
the details of the oil/water interfaces.
Typical and fundamental examples of oil/water interfaces were studied by
Richmond and co-workers [55, 109, 111]. Figure 9.11a shows the SFG spectra of
carbon tetrachloride (CCl 4 )/water and 1,2-dichloroethane (DCE)/water interfaces
in comparison to that of air/water interface. We find that the CCl 4 /water spectrum
retains the two-band structure that resembles air/water, while the spectrum of
DCE/water interface becomes structureless and weaker. The apparent spectral
difference may allow various interpretations. The MD analysis can clarify the
interpretation of the spectra in relation to the structure of oil/water interfaces.
9 Applications: Aqueous Interfaces
3000
3200
3400
3600
3800
0
0.5
1
1.5
3000
3200
3400
3600
3800
-4
-2
0
2
4
(a) SFG intensity (Exp.)
(b) Im[
] (MD)
(2)
Frequency [cm ]
-1
Frequency [cm ]
-1
CCl4 /water
DCE /water
3000
3200
3400
3600
3800
-4
-2
0
2
4
(d) Im[
] (Free O-H)
(2)
Frequency [cm ]
-1
(c) Free O-H at water/DCE interface
Air /water
CCl4 /water
DCE /water
Fig. 9.11 (a) Experimental SFG spectra of neat water/vapor (black), water/CCl 4 (blue) and
water/1,2-dichloroethane (DCE, red) interfaces [55, 109, 111]. (b) Calculated Im[χ (2) ] spectra
of the three interfaces [34]. (c) Illustration of free O–H at water/DCE interface. (d) Calculated
Im[χ (2) ] spectra by restricting the water molecules having free O–H bonds at the interfaces. The
free O–H band at CCl 4 /water is little perturbed, while that at DCE/water interface is more red
shifted and broadened. (Reprinted with the permission from Ref. [34]. Copyright 2012 American
Chemical Society)
techniques [48, 55] as well as MD simulation [5, 6, 12, 82]. A main challenge of
investigating oil/water interfaces lies in difficulties of selective detection of interfacial molecules with sufficient spatial resolution. The interface-sensitive nonlinear
spectroscopy is able to probe buried oil/water interfaces with excellent selectivity
as long as it is accessible by light. The SHG was applied to reveal detailed
polarity environment in the vicinity of the liquid-liquid interfaces [100, 101]. The
collaboration of vibrational SFG spectroscopy and MD analysis is powerful to reveal
the details of the oil/water interfaces.
Typical and fundamental examples of oil/water interfaces were studied by
Richmond and co-workers [55, 109, 111]. Figure 9.11a shows the SFG spectra of
carbon tetrachloride (CCl 4 )/water and 1,2-dichloroethane (DCE)/water interfaces
in comparison to that of air/water interface. We find that the CCl 4 /water spectrum
retains the two-band structure that resembles air/water, while the spectrum of
DCE/water interface becomes structureless and weaker. The apparent spectral
difference may allow various interpretations. The MD analysis can clarify the
interpretation of the spectra in relation to the structure of oil/water interfaces.