

9.3 Electrolyte Solution Surfaces
235
0
2
4
6
2
4
6
0
1
2
0
0
0
0
1
0.5
1.5
0.00
0.05
0.10
0.15
0.20
SPS
SSP
H 3 O
+
HSO 4
-
SO 4
2(a) same pKa’s
(b) pKa 2 >> 0
(c) pKa 1 >> 0
H 2 SO 4
Frequency [cm
-1 ]
Frequency [cm
-1
]
SFG intensity [arb.unit]
O-H band
S-O band
pure water
sulfric acid
Experiment
Experiment
(*)
(a)
(b)
(c)
(a)
(b)
(c)
MD Prediction
MD Prediction
Assummed
Ion Compositions
(a), (b), (c)
3000 3200 3400 3600 3800
3000 3200 3400 3600 3800
3000 3200 3400 3600 3800
0
3000 3200 3400 3600 3800
1000
1100
1200
1300
1000
1100
1200
1300
1000
1100
1200
1300
1000
1100
1200
1300
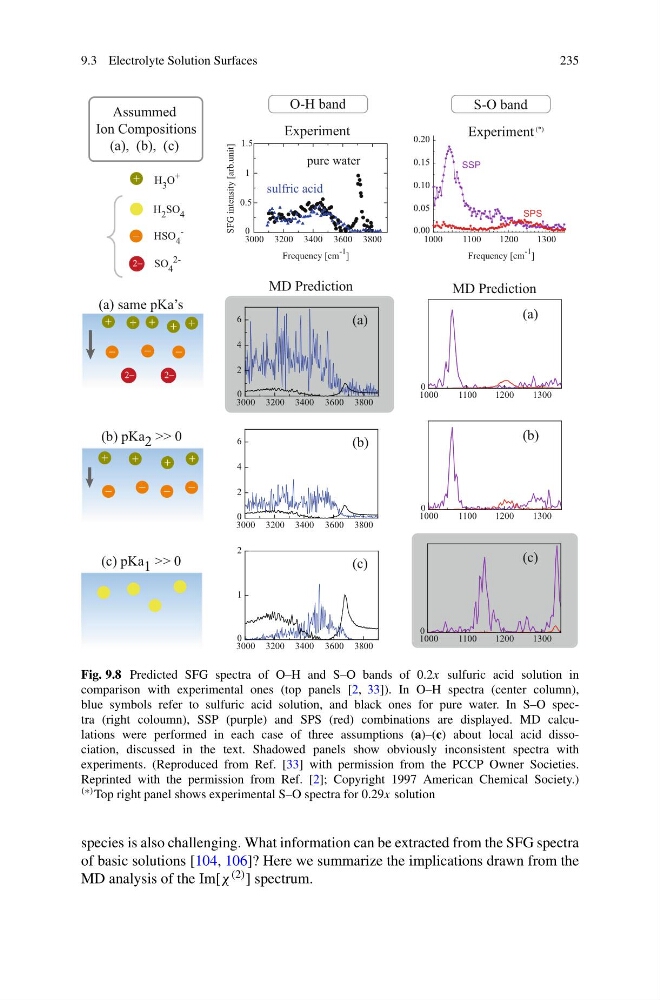
Fig. 9.8 Predicted SFG spectra of O–H and S–O bands of 0.2x sulfuric acid solution in
comparison with experimental ones (top panels [2, 33]). In O–H spectra (center column),
blue symbols refer to sulfuric acid solution, and black ones for pure water. In S–O spectra (right coloumn), SSP (purple) and SPS (red) combinations are displayed. MD calculations were performed in each case of three assumptions (a)–(c) about local acid dissociation, discussed in the text. Shadowed panels show obviously inconsistent spectra with
experiments. (Reproduced from Ref. [33] with permission from the PCCP Owner Societies.
Reprinted with the permission from Ref. [2]; Copyright 1997 American Chemical Society.)
(∗) Top right panel shows experimental S–O spectra for 0.29x solution
species is also challenging. What information can be extracted from the SFG spectra
of basic solutions [104, 106]? Here we summarize the implications drawn from the
MD analysis of the Im[χ (2) ] spectrum.
235
0
2
4
6
2
4
6
0
1
2
0
0
0
0
1
0.5
1.5
0.00
0.05
0.10
0.15
0.20
SPS
SSP
H 3 O
+
HSO 4
-
SO 4
2(a) same pKa’s
(b) pKa 2 >> 0
(c) pKa 1 >> 0
H 2 SO 4
Frequency [cm
-1 ]
Frequency [cm
-1
]
SFG intensity [arb.unit]
O-H band
S-O band
pure water
sulfric acid
Experiment
Experiment
(*)
(a)
(b)
(c)
(a)
(b)
(c)
MD Prediction
MD Prediction
Assummed
Ion Compositions
(a), (b), (c)
3000 3200 3400 3600 3800
3000 3200 3400 3600 3800
3000 3200 3400 3600 3800
0
3000 3200 3400 3600 3800
1000
1100
1200
1300
1000
1100
1200
1300
1000
1100
1200
1300
1000
1100
1200
1300
Fig. 9.8 Predicted SFG spectra of O–H and S–O bands of 0.2x sulfuric acid solution in
comparison with experimental ones (top panels [2, 33]). In O–H spectra (center column),
blue symbols refer to sulfuric acid solution, and black ones for pure water. In S–O spectra (right coloumn), SSP (purple) and SPS (red) combinations are displayed. MD calculations were performed in each case of three assumptions (a)–(c) about local acid dissociation, discussed in the text. Shadowed panels show obviously inconsistent spectra with
experiments. (Reproduced from Ref. [33] with permission from the PCCP Owner Societies.
Reprinted with the permission from Ref. [2]; Copyright 1997 American Chemical Society.)
(∗) Top right panel shows experimental S–O spectra for 0.29x solution
species is also challenging. What information can be extracted from the SFG spectra
of basic solutions [104, 106]? Here we summarize the implications drawn from the
MD analysis of the Im[χ (2) ] spectrum.