

9.3 Electrolyte Solution Surfaces
227
9.3.1 Halide Ions: Surface Segregation
The MD simulation predicts the order of surface preference to be I − > Br
− >
Cl
− > F − , indicating that larger anions (e.g. I − ) exhibit surface preference while
smaller ones (F − ) are buried into the bulk liquid (see Fig. 9.3). In response to the MD
prediction, SFG measurements of NaX (X = F − , Cl − , Br − , I − ) aqueous solutions
were carried out in 2004 by Liu et al. [49] and Raymond et al. [85]. While the
two groups reported analogous spectra of NaX solutions, their interpretations were
contradictory about the essential issue whether the observed SFG spectra support
the surface preference of I − and Br − . This ambiguity clearly indicates the need of
MD analysis to draw definite interpretation from the SFG spectra.
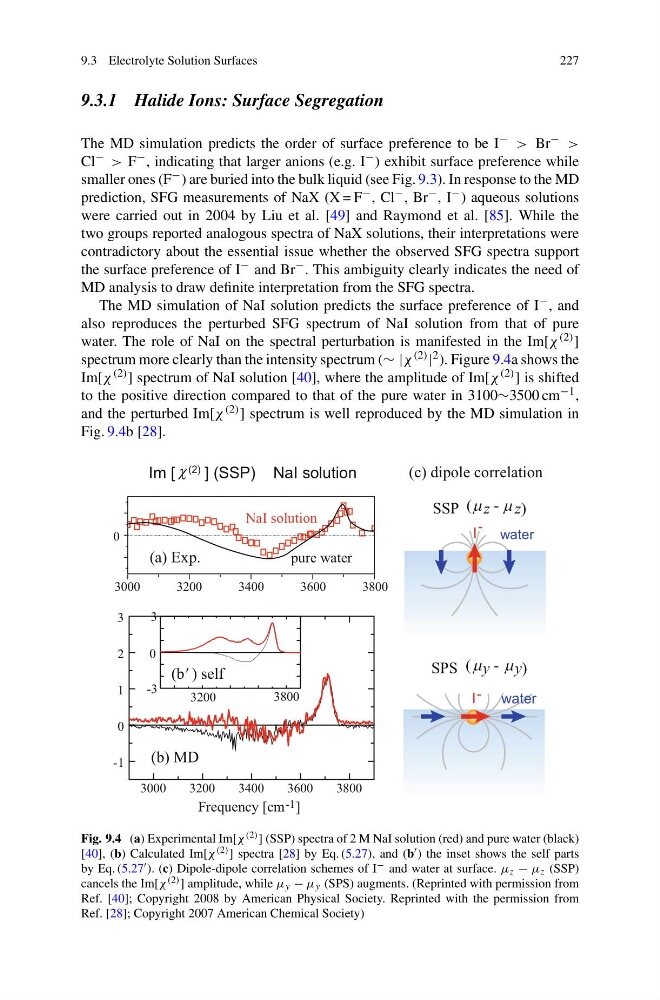
The MD simulation of NaI solution predicts the surface preference of I − , and
also reproduces the perturbed SFG spectrum of NaI solution from that of pure
water. The role of NaI on the spectral perturbation is manifested in the Im[χ (2) ]
spectrum more clearly than the intensity spectrum (∼ |χ (2) | 2 ). Figure 9.4a shows the
Im[χ (2) ] spectrum of NaI solution [40], where the amplitude of Im[χ (2) ] is shifted
to the positive direction compared to that of the pure water in 3100∼3500 cm −1 ,
and the perturbed Im[χ (2) ] spectrum is well reproduced by the MD simulation in
Fig. 9.4b [28].
Im [
] (SSP) NaI solution
(2)
-1
3000
3200
3400
3600
3800
-1
0
1
2
3
(b) MD
(c) dipole correlation
3200
0
3
-3
3800
(b' ) self
Frequency [cm ]
water
I
3000
3200
3400
3600
3800
0
(a) Exp.
-
water
I -
SSP ( z - z)
SPS ( y - y)
NaI solution
pure water
Fig. 9.4 (a) Experimental Im[χ (2) ] (SSP) spectra of 2 M NaI solution (red) and pure water (black)
[40], (b) Calculated Im[χ (2) ] spectra [28] by Eq. (5.27), and (b ) the inset shows the self parts
by Eq. (5.27 ). (c) Dipole-dipole correlation schemes of I − and water at surface. μ z − μ z (SSP)
cancels the Im[χ (2) ] amplitude, while μ y − μ y (SPS) augments. (Reprinted with permission from
Ref. [40]; Copyright 2008 by American Physical Society. Reprinted with the permission from
Ref. [28]; Copyright 2007 American Chemical Society)
227
9.3.1 Halide Ions: Surface Segregation
The MD simulation predicts the order of surface preference to be I − > Br
− >
Cl
− > F − , indicating that larger anions (e.g. I − ) exhibit surface preference while
smaller ones (F − ) are buried into the bulk liquid (see Fig. 9.3). In response to the MD
prediction, SFG measurements of NaX (X = F − , Cl − , Br − , I − ) aqueous solutions
were carried out in 2004 by Liu et al. [49] and Raymond et al. [85]. While the
two groups reported analogous spectra of NaX solutions, their interpretations were
contradictory about the essential issue whether the observed SFG spectra support
the surface preference of I − and Br − . This ambiguity clearly indicates the need of
MD analysis to draw definite interpretation from the SFG spectra.
The MD simulation of NaI solution predicts the surface preference of I − , and
also reproduces the perturbed SFG spectrum of NaI solution from that of pure
water. The role of NaI on the spectral perturbation is manifested in the Im[χ (2) ]
spectrum more clearly than the intensity spectrum (∼ |χ (2) | 2 ). Figure 9.4a shows the
Im[χ (2) ] spectrum of NaI solution [40], where the amplitude of Im[χ (2) ] is shifted
to the positive direction compared to that of the pure water in 3100∼3500 cm −1 ,
and the perturbed Im[χ (2) ] spectrum is well reproduced by the MD simulation in
Fig. 9.4b [28].
Im [
] (SSP) NaI solution
(2)
-1
3000
3200
3400
3600
3800
-1
0
1
2
3
(b) MD
(c) dipole correlation
3200
0
3
-3
3800
(b' ) self
Frequency [cm ]
water
I
3000
3200
3400
3600
3800
0
(a) Exp.
-
water
I -
SSP ( z - z)
SPS ( y - y)
NaI solution
pure water
Fig. 9.4 (a) Experimental Im[χ (2) ] (SSP) spectra of 2 M NaI solution (red) and pure water (black)
[40], (b) Calculated Im[χ (2) ] spectra [28] by Eq. (5.27), and (b ) the inset shows the self parts
by Eq. (5.27 ). (c) Dipole-dipole correlation schemes of I − and water at surface. μ z − μ z (SSP)
cancels the Im[χ (2) ] amplitude, while μ y − μ y (SPS) augments. (Reprinted with permission from
Ref. [40]; Copyright 2008 by American Physical Society. Reprinted with the permission from
Ref. [28]; Copyright 2007 American Chemical Society)