

17 Vibrational Microspectroscopy for Analysis of Atherosclerotic Arteries
513
17.3 Vibrational Spectroscopy
17.3.1 Chemometrics in Spectroscopic Imaging
of Atherosclerosis
Chemometrics are data analysis techniques based on mathematics, statistics and
computer science. their development and ongoing introduction into almost all
branches of science is dictated by the increasing amount of information created by
more modern methods [77–79]. It is this large amount of data that brings about the
use of chemometrics, since in simpler cases, the scientist manages to handle the
data analysis by him/herself. therefore, with the development of high throughput
imaging systems that are now available, it is a necessity to become acquainted with
the capabilities of advanced data analysis techniques. Even the use of the most basic
ones gives a very powerful tool to a scientist.
Before going into details of the techniques used in spectroscopy in the field
of atherosclerosis, a more general description is needed. In order not to confuse
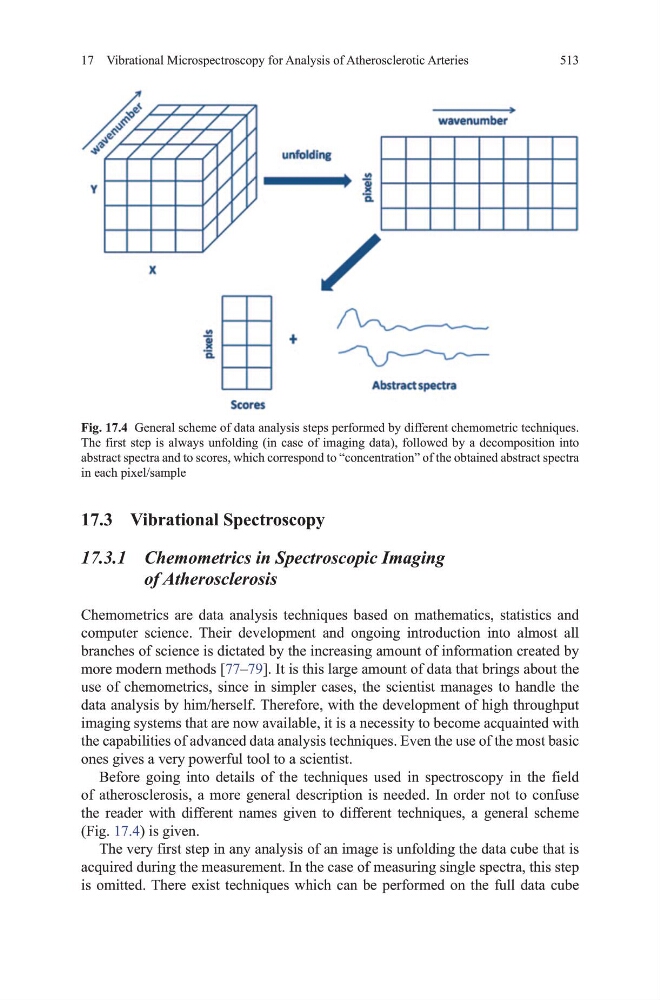
the reader with different names given to different techniques, a general scheme
(Fig. 17.4) is given.
the very first step in any analysis of an image is unfolding the data cube that is
acquired during the measurement. In the case of measuring single spectra, this step
is omitted. there exist techniques which can be performed on the full data cube
Fig. 17.4 general scheme of data analysis steps performed by different chemometric techniques.
the first step is always unfolding (in case of imaging data), followed by a decomposition into
abstract spectra and to scores, which correspond to “concentration” of the obtained abstract spectra
in each pixel/sample
513
17.3 Vibrational Spectroscopy
17.3.1 Chemometrics in Spectroscopic Imaging
of Atherosclerosis
Chemometrics are data analysis techniques based on mathematics, statistics and
computer science. their development and ongoing introduction into almost all
branches of science is dictated by the increasing amount of information created by
more modern methods [77–79]. It is this large amount of data that brings about the
use of chemometrics, since in simpler cases, the scientist manages to handle the
data analysis by him/herself. therefore, with the development of high throughput
imaging systems that are now available, it is a necessity to become acquainted with
the capabilities of advanced data analysis techniques. Even the use of the most basic
ones gives a very powerful tool to a scientist.
Before going into details of the techniques used in spectroscopy in the field
of atherosclerosis, a more general description is needed. In order not to confuse
the reader with different names given to different techniques, a general scheme
(Fig. 17.4) is given.
the very first step in any analysis of an image is unfolding the data cube that is
acquired during the measurement. In the case of measuring single spectra, this step
is omitted. there exist techniques which can be performed on the full data cube
Fig. 17.4 general scheme of data analysis steps performed by different chemometric techniques.
the first step is always unfolding (in case of imaging data), followed by a decomposition into
abstract spectra and to scores, which correspond to “concentration” of the obtained abstract spectra
in each pixel/sample