

479
16 Fourier Transform Infrared (Ft-Ir) Spectroscopic Imaging …
16.3 IR Spectroscopic Imaging for Automated Histopathology
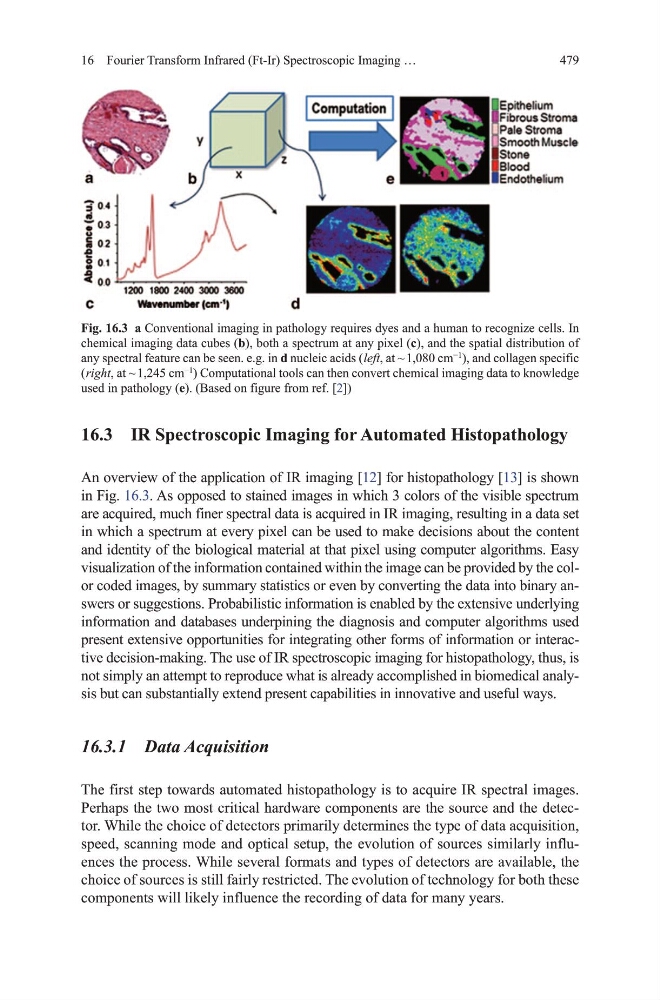
An overview of the application of IR imaging [12] for histopathology [13] is shown
in Fig. 16.3. As opposed to stained images in which 3 colors of the visible spectrum
are acquired, much finer spectral data is acquired in IR imaging, resulting in a data set
in which a spectrum at every pixel can be used to make decisions about the content
and identity of the biological material at that pixel using computer algorithms. Easy
visualization of the information contained within the image can be provided by the color coded images, by summary statistics or even by converting the data into binary answers or suggestions. Probabilistic information is enabled by the extensive underlying
information and databases underpining the diagnosis and computer algorithms used
present extensive opportunities for integrating other forms of information or interactive decision-making. the use of IR spectroscopic imaging for histopathology, thus, is
not simply an attempt to reproduce what is already accomplished in biomedical analysis but can substantially extend present capabilities in innovative and useful ways.
16.3.1 Data Acquisition
the first step towards automated histopathology is to acquire IR spectral images.
Perhaps the two most critical hardware components are the source and the detector. While the choice of detectors primarily determines the type of data acquisition,
speed, scanning mode and optical setup, the evolution of sources similarly influences the process. While several formats and types of detectors are available, the
choice of sources is still fairly restricted. the evolution of technology for both these
components will likely influence the recording of data for many years.
Fig. 16.3 a Conventional imaging in pathology requires dyes and a human to recognize cells. In
chemical imaging data cubes (b), both a spectrum at any pixel (c), and the spatial distribution of
any spectral feature can be seen. e.g. in d nucleic acids ( left, at ~ 1,080 cm
−1
), and collagen specific
( right, at ~ 1,245 cm
−1
) Computational tools can then convert chemical imaging data to knowledge
used in pathology (e). (Based on figure from ref. [2])
16 Fourier Transform Infrared (Ft-Ir) Spectroscopic Imaging …
16.3 IR Spectroscopic Imaging for Automated Histopathology
An overview of the application of IR imaging [12] for histopathology [13] is shown
in Fig. 16.3. As opposed to stained images in which 3 colors of the visible spectrum
are acquired, much finer spectral data is acquired in IR imaging, resulting in a data set
in which a spectrum at every pixel can be used to make decisions about the content
and identity of the biological material at that pixel using computer algorithms. Easy
visualization of the information contained within the image can be provided by the color coded images, by summary statistics or even by converting the data into binary answers or suggestions. Probabilistic information is enabled by the extensive underlying
information and databases underpining the diagnosis and computer algorithms used
present extensive opportunities for integrating other forms of information or interactive decision-making. the use of IR spectroscopic imaging for histopathology, thus, is
not simply an attempt to reproduce what is already accomplished in biomedical analysis but can substantially extend present capabilities in innovative and useful ways.
16.3.1 Data Acquisition
the first step towards automated histopathology is to acquire IR spectral images.
Perhaps the two most critical hardware components are the source and the detector. While the choice of detectors primarily determines the type of data acquisition,
speed, scanning mode and optical setup, the evolution of sources similarly influences the process. While several formats and types of detectors are available, the
choice of sources is still fairly restricted. the evolution of technology for both these
components will likely influence the recording of data for many years.
Fig. 16.3 a Conventional imaging in pathology requires dyes and a human to recognize cells. In
chemical imaging data cubes (b), both a spectrum at any pixel (c), and the spatial distribution of
any spectral feature can be seen. e.g. in d nucleic acids ( left, at ~ 1,080 cm
−1
), and collagen specific
( right, at ~ 1,245 cm
−1
) Computational tools can then convert chemical imaging data to knowledge
used in pathology (e). (Based on figure from ref. [2])