

455
15 FtIR Imaging of tissues: techniques and methods of Analysis
I band within the plagues is found at similar wavenumber as previously reported
and is accompanied by a shoulder feature at 1655 cm
−1
. however, the FtIR spectrum of a pure peptide Aβ 1–42 , the major constituent of Ad plaques, shows the presence of an amide I band at 1625 cm
−1
, confirming a heterogeneous composition of
proteins within the plaque. In another experiment, synchrotron-based IR maps have
been correlated with synchrotron X-ray fluorescence (SXRF) imaging of metal elements [127]. This study showed a high accumulation of Cu, Zn, and β-sheet proteins in the amyloid plaques of the human Ad tissue. however, the same correlation
performed for the brain tissue sections of double transgenic PSAPP mouse, which
represents the end-stage of Ad, does not reveal the same effect of metal accumulation
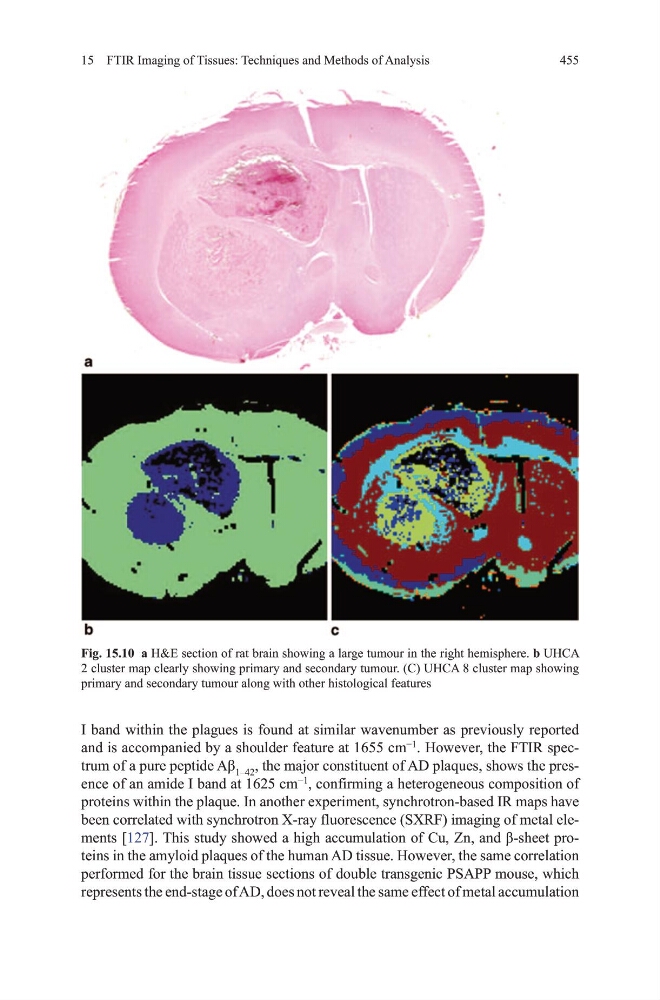
Fig. 15.10 a h&E section of rat brain showing a large tumour in the right hemisphere. b uhCA
2 cluster map clearly showing primary and secondary tumour. (C) uhCA 8 cluster map showing
primary and secondary tumour along with other histological features
15 FtIR Imaging of tissues: techniques and methods of Analysis
I band within the plagues is found at similar wavenumber as previously reported
and is accompanied by a shoulder feature at 1655 cm
−1
. however, the FtIR spectrum of a pure peptide Aβ 1–42 , the major constituent of Ad plaques, shows the presence of an amide I band at 1625 cm
−1
, confirming a heterogeneous composition of
proteins within the plaque. In another experiment, synchrotron-based IR maps have
been correlated with synchrotron X-ray fluorescence (SXRF) imaging of metal elements [127]. This study showed a high accumulation of Cu, Zn, and β-sheet proteins in the amyloid plaques of the human Ad tissue. however, the same correlation
performed for the brain tissue sections of double transgenic PSAPP mouse, which
represents the end-stage of Ad, does not reveal the same effect of metal accumulation
Fig. 15.10 a h&E section of rat brain showing a large tumour in the right hemisphere. b uhCA
2 cluster map clearly showing primary and secondary tumour. (C) uhCA 8 cluster map showing
primary and secondary tumour along with other histological features