

444
K. malek et al.
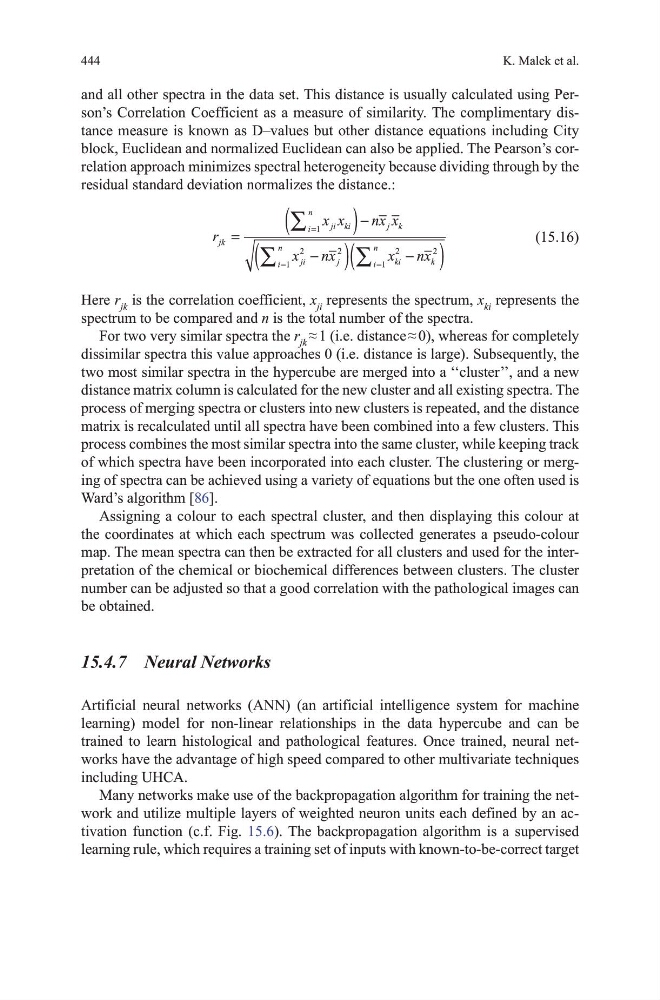
and all other spectra in the data set. this distance is usually calculated using Person’s Correlation Coefficient as a measure of similarity. the complimentary distance measure is known as d–values but other distance equations including City
block, Euclidean and normalized Euclidean can also be applied. the Pearson’s correlation approach minimizes spectral heterogeneity because dividing through by the
residual standard deviation normalizes the distance.:
r
x x
nx x
x nx
x nx
jk
ji ki
i
n
j k
ji
j
i
n
ki
k
i
n
=
(
) −
−
(
)
−
(
)
=
=
=
∑
∑
∑
1
2
2
1
2
2
1
(15.16)
here r jk is the correlation coefficient, x ji represents the spectrum, x ki represents the
spectrum to be compared and n is the total number of the spectra.
For two very similar spectra the r jk ≈ 1 (i.e. distance ≈ 0), whereas for completely
dissimilar spectra this value approaches 0 (i.e. distance is large). Subsequently, the
two most similar spectra in the hypercube are merged into a ‘‘cluster’’, and a new
distance matrix column is calculated for the new cluster and all existing spectra. the
process of merging spectra or clusters into new clusters is repeated, and the distance
matrix is recalculated until all spectra have been combined into a few clusters. this
process combines the most similar spectra into the same cluster, while keeping track
of which spectra have been incorporated into each cluster. the clustering or merging of spectra can be achieved using a variety of equations but the one often used is
Ward’s algorithm [86].
Assigning a colour to each spectral cluster, and then displaying this colour at
the coordinates at which each spectrum was collected generates a pseudo-colour
map. the mean spectra can then be extracted for all clusters and used for the interpretation of the chemical or biochemical differences between clusters. the cluster
number can be adjusted so that a good correlation with the pathological images can
be obtained.
15.4.7 Neural Networks
Artificial neural networks (ANN) (an artificial intelligence system for machine
learning) model for non-linear relationships in the data hypercube and can be
trained to learn histological and pathological features. once trained, neural networks have the advantage of high speed compared to other multivariate techniques
including uhCA.
many networks make use of the backpropagation algorithm for training the network and utilize multiple layers of weighted neuron units each defined by an activation function (c.f. Fig. 15.6). the backpropagation algorithm is a supervised
learning rule, which requires a training set of inputs with known-to-be-correct target
K. malek et al.
and all other spectra in the data set. this distance is usually calculated using Person’s Correlation Coefficient as a measure of similarity. the complimentary distance measure is known as d–values but other distance equations including City
block, Euclidean and normalized Euclidean can also be applied. the Pearson’s correlation approach minimizes spectral heterogeneity because dividing through by the
residual standard deviation normalizes the distance.:
r
x x
nx x
x nx
x nx
jk
ji ki
i
n
j k
ji
j
i
n
ki
k
i
n
=
(
) −
−
(
)
−
(
)
=
=
=
∑
∑
∑
1
2
2
1
2
2
1
(15.16)
here r jk is the correlation coefficient, x ji represents the spectrum, x ki represents the
spectrum to be compared and n is the total number of the spectra.
For two very similar spectra the r jk ≈ 1 (i.e. distance ≈ 0), whereas for completely
dissimilar spectra this value approaches 0 (i.e. distance is large). Subsequently, the
two most similar spectra in the hypercube are merged into a ‘‘cluster’’, and a new
distance matrix column is calculated for the new cluster and all existing spectra. the
process of merging spectra or clusters into new clusters is repeated, and the distance
matrix is recalculated until all spectra have been combined into a few clusters. this
process combines the most similar spectra into the same cluster, while keeping track
of which spectra have been incorporated into each cluster. the clustering or merging of spectra can be achieved using a variety of equations but the one often used is
Ward’s algorithm [86].
Assigning a colour to each spectral cluster, and then displaying this colour at
the coordinates at which each spectrum was collected generates a pseudo-colour
map. the mean spectra can then be extracted for all clusters and used for the interpretation of the chemical or biochemical differences between clusters. the cluster
number can be adjusted so that a good correlation with the pathological images can
be obtained.
15.4.7 Neural Networks
Artificial neural networks (ANN) (an artificial intelligence system for machine
learning) model for non-linear relationships in the data hypercube and can be
trained to learn histological and pathological features. once trained, neural networks have the advantage of high speed compared to other multivariate techniques
including uhCA.
many networks make use of the backpropagation algorithm for training the network and utilize multiple layers of weighted neuron units each defined by an activation function (c.f. Fig. 15.6). the backpropagation algorithm is a supervised
learning rule, which requires a training set of inputs with known-to-be-correct target