

440
K. malek et al.
Prior to classification, a normalization or standardization step is often required
so that the extracted spectral information can be used for comparison between
classes. one type of normalization is known as min/max normalization and can be
applied providing the peak absorbance band is constant between samples, which
is often not the case. A number of peaks in a biological sample are often used as
maximum peaks for min/max normalization and providing the chosen peak is stable
and consistent then this method is feasible. Such bands include the amide I, amide
II and the Ch 2 asymmetric stretching peak. In this type of normalization the peak
height of the chosen band is adjusted to 1 by multiplying the whole spectrum by a
multiplication factor. In this case the absorbance information in the spectrum is lost
and thus the normalized spectra are relative absorbance spectra and only suitable
for qualitative analysis. In most studies min/max normalized spectra are only used
for display purposes, whereas for classification purposes non-normalized spectra
are normally incorporated into the model. An alternative to min/max normalization is vector normalization where the normalization is not based on a single peak
but rather each spectrum is divided by the Euclidean norm. vector normalization
is often applied to second derivatives prior to cluster analysis, because second derivatives have values below zero whereas min-max normalization can only process
FtIR spectra with positive values. As a general approach for tissue analysis and
providing the baselines are not affected by mie scattering or light dispersion and
where the signal-to-noise is excellent we would take the second derivative and then
vector normalize the data prior to cluster analysis.
15.4.2 Light Scattering Correction
Normalization and derivative analysis can correct for differences in sample thickness and sloping baselines but if light scattering and dispersion distort the spectra
then a modelling approach is required. Scattering results when the light is deviated
from the detector resulting in broad oscillating baselines with shifts in peak position and band shape distortion. one of the main forms of scattering observed in the
FtIR spectra of cells is mie scattering. mie scattering is manifest when the scattering particles are in the range of infrared wavelengths (5–12 μm), which is the size
of small cells and nuclei.
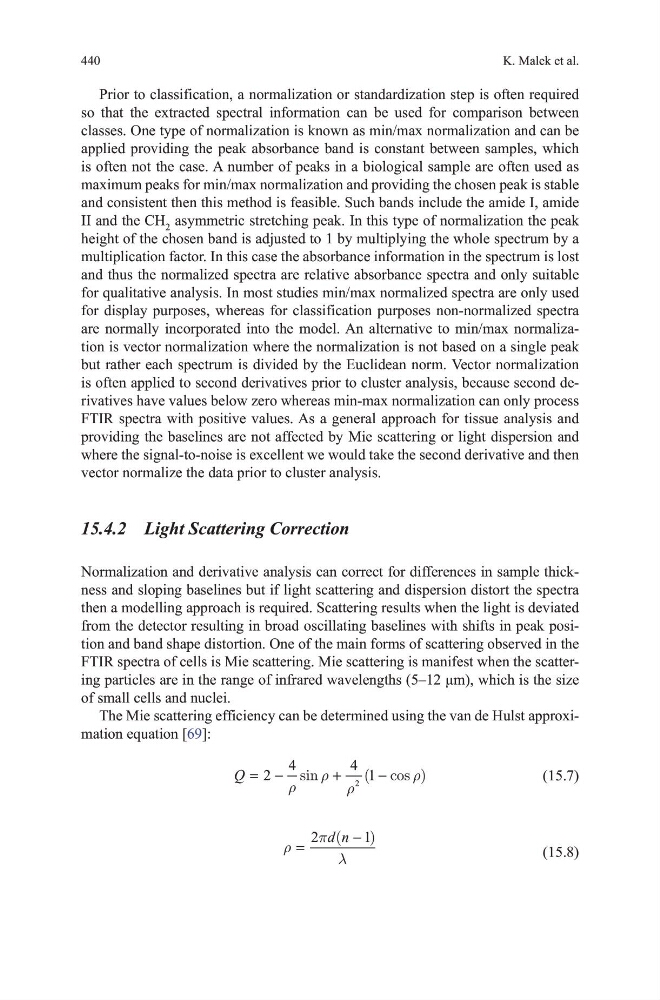
the mie scattering efficiency can be determined using the van de hulst approximation equation [69]:
Q = −
+
−
2
4
4 1
2
ρ
ρ ρ
ρ
sin
( cos )
(15.7)
ρ
π
λ
=
−
2
1
d n
(
)
(15.8)
K. malek et al.
Prior to classification, a normalization or standardization step is often required
so that the extracted spectral information can be used for comparison between
classes. one type of normalization is known as min/max normalization and can be
applied providing the peak absorbance band is constant between samples, which
is often not the case. A number of peaks in a biological sample are often used as
maximum peaks for min/max normalization and providing the chosen peak is stable
and consistent then this method is feasible. Such bands include the amide I, amide
II and the Ch 2 asymmetric stretching peak. In this type of normalization the peak
height of the chosen band is adjusted to 1 by multiplying the whole spectrum by a
multiplication factor. In this case the absorbance information in the spectrum is lost
and thus the normalized spectra are relative absorbance spectra and only suitable
for qualitative analysis. In most studies min/max normalized spectra are only used
for display purposes, whereas for classification purposes non-normalized spectra
are normally incorporated into the model. An alternative to min/max normalization is vector normalization where the normalization is not based on a single peak
but rather each spectrum is divided by the Euclidean norm. vector normalization
is often applied to second derivatives prior to cluster analysis, because second derivatives have values below zero whereas min-max normalization can only process
FtIR spectra with positive values. As a general approach for tissue analysis and
providing the baselines are not affected by mie scattering or light dispersion and
where the signal-to-noise is excellent we would take the second derivative and then
vector normalize the data prior to cluster analysis.
15.4.2 Light Scattering Correction
Normalization and derivative analysis can correct for differences in sample thickness and sloping baselines but if light scattering and dispersion distort the spectra
then a modelling approach is required. Scattering results when the light is deviated
from the detector resulting in broad oscillating baselines with shifts in peak position and band shape distortion. one of the main forms of scattering observed in the
FtIR spectra of cells is mie scattering. mie scattering is manifest when the scattering particles are in the range of infrared wavelengths (5–12 μm), which is the size
of small cells and nuclei.
the mie scattering efficiency can be determined using the van de hulst approximation equation [69]:
Q = −
+
−
2
4
4 1
2
ρ
ρ ρ
ρ
sin
( cos )
(15.7)
ρ
π
λ
=
−
2
1
d n
(
)
(15.8)