

422
K. malek et al.
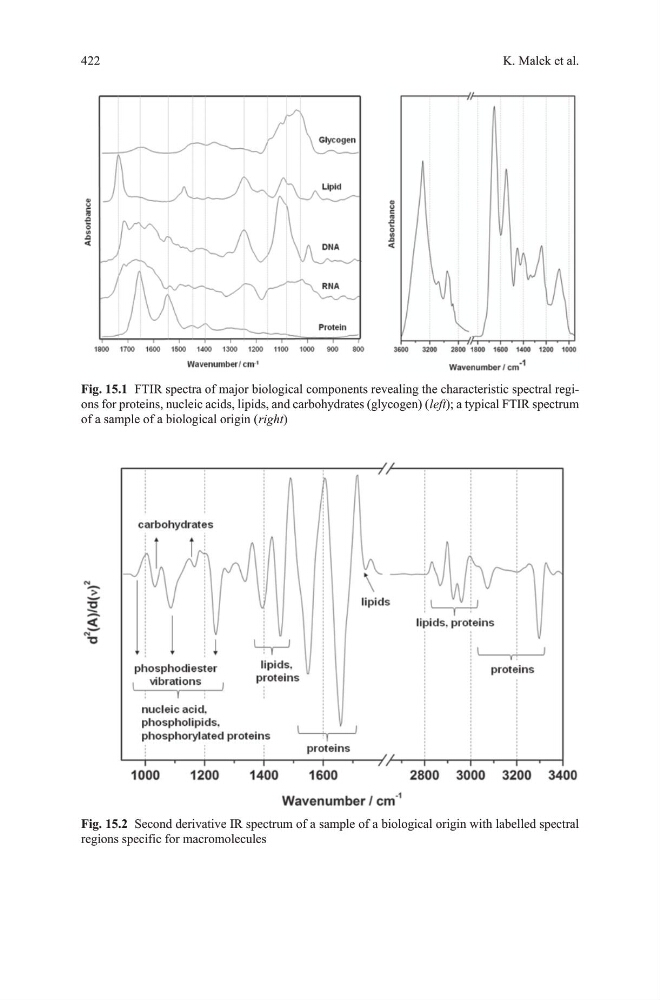
Fig. 15.2 Second derivative IR spectrum of a sample of a biological origin with labelled spectral
regions specific for macromolecules
Fig. 15.1 FtIR spectra of major biological components revealing the characteristic spectral regions for proteins, nucleic acids, lipids, and carbohydrates (glycogen) ( left); a typical FtIR spectrum
of a sample of a biological origin ( right)
K. malek et al.
Fig. 15.2 Second derivative IR spectrum of a sample of a biological origin with labelled spectral
regions specific for macromolecules
Fig. 15.1 FtIR spectra of major biological components revealing the characteristic spectral regions for proteins, nucleic acids, lipids, and carbohydrates (glycogen) ( left); a typical FtIR spectrum
of a sample of a biological origin ( right)