

409
14 Quantitative Analysis of disease Biomarkers using …
the assay was also performed for the lung cancer marker CEA, and its Lod was
determined to be 0.1 pg/mL.
J. Irudayaraj and co-workers [51] performed a SERS-based immunoassay using a sandwich immunocomplex between antibody-conjugated gold nanorods and
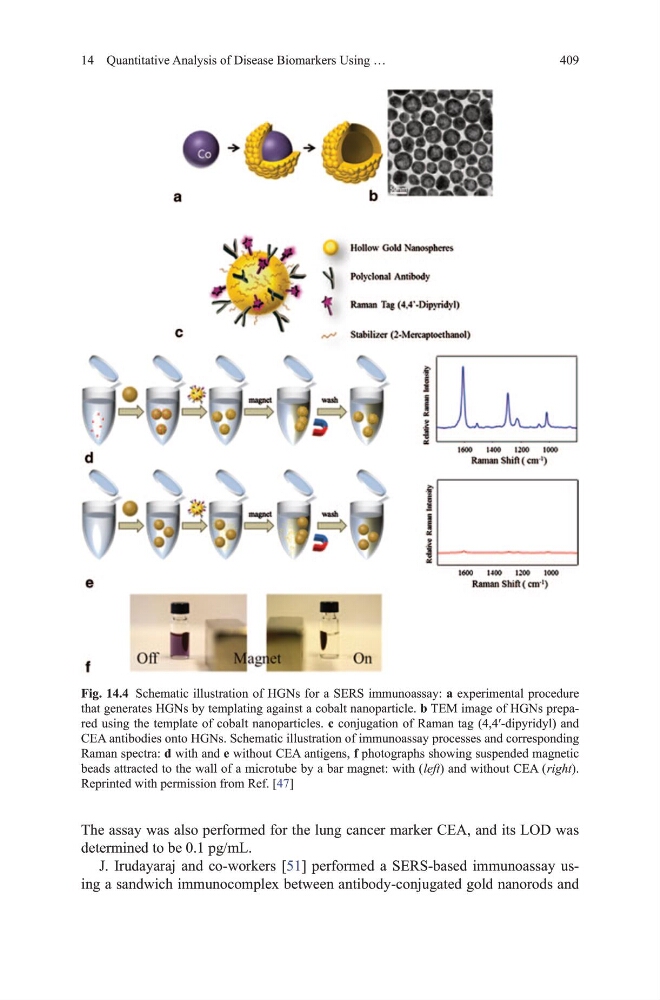
Fig. 14.4 Schematic illustration of hgNs for a SERS immunoassay: a experimental procedure
that generates hgNs by templating against a cobalt nanoparticle. b tEm image of hgNs prepared using the template of cobalt nanoparticles. c conjugation of Raman tag (4,4′-dipyridyl) and
CEA antibodies onto hgNs. Schematic illustration of immunoassay processes and corresponding
Raman spectra: d with and e without CEA antigens, f photographs showing suspended magnetic
beads attracted to the wall of a microtube by a bar magnet: with ( left) and without CEA ( right).
Reprinted with permission from Ref. [47]
14 Quantitative Analysis of disease Biomarkers using …
the assay was also performed for the lung cancer marker CEA, and its Lod was
determined to be 0.1 pg/mL.
J. Irudayaraj and co-workers [51] performed a SERS-based immunoassay using a sandwich immunocomplex between antibody-conjugated gold nanorods and
Fig. 14.4 Schematic illustration of hgNs for a SERS immunoassay: a experimental procedure
that generates hgNs by templating against a cobalt nanoparticle. b tEm image of hgNs prepared using the template of cobalt nanoparticles. c conjugation of Raman tag (4,4′-dipyridyl) and
CEA antibodies onto hgNs. Schematic illustration of immunoassay processes and corresponding
Raman spectra: d with and e without CEA antigens, f photographs showing suspended magnetic
beads attracted to the wall of a microtube by a bar magnet: with ( left) and without CEA ( right).
Reprinted with permission from Ref. [47]