

390
H. J. Byrne et al.
nanopolystyrene can now be localised in the cytoplasm according to cluster 5, the
corresponding mean spectrum of which is presented in Fig. 13.19 IIIa. Although
some cellular features clearly contribute to the cluster spectrum, it is dominated
by specific features originating from polystyrene (Fig. 13.19 IIIb). K-means cluster analysis yields the average spectra for the identified clusters. these average
spectra can contain contributions from points on the boundaries between the cellular regions and a direct comparison does not always easily facilitate identification
of the differences in the biochemical composition. Cluster 5 clearly identifies the
presence of polystyrene nanoparticles localised in the cytoplasm, but the averaged
spectrum also exhibits clear contributions of the biological environment. PCA can
be employed to highlight the biochemical differences between the subcellular regions [150]. In Fig. 13.19 Ib, cluster 5 is predominantly surrounded by cytoplasmic
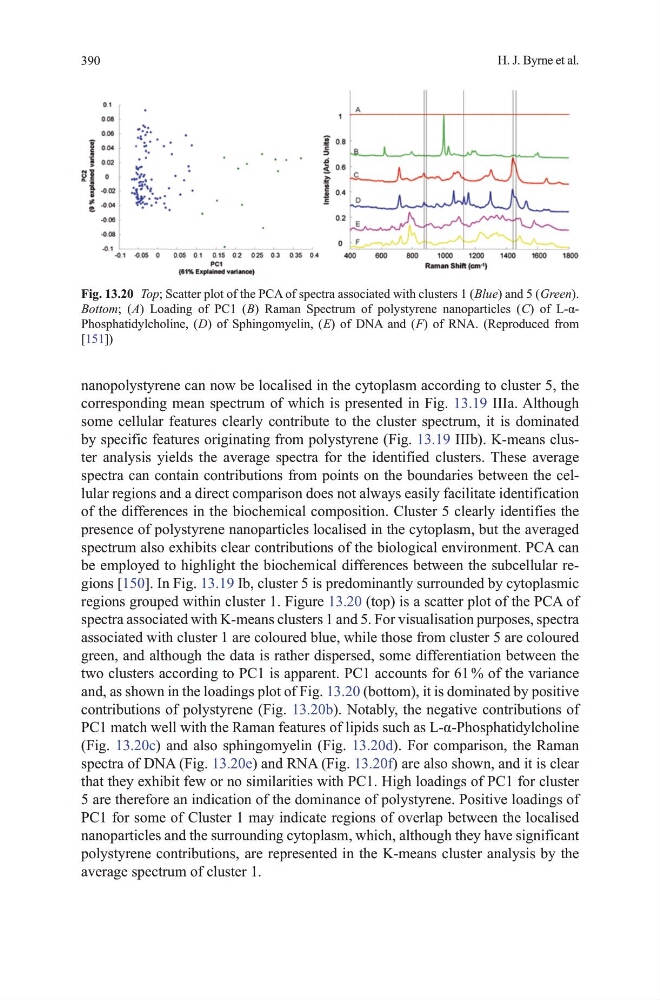
regions grouped within cluster 1. Figure 13.20 (top) is a scatter plot of the PCA of
spectra associated with K-means clusters 1 and 5. For visualisation purposes, spectra
associated with cluster 1 are coloured blue, while those from cluster 5 are coloured
green, and although the data is rather dispersed, some differentiation between the
two clusters according to PC1 is apparent. PC1 accounts for 61 % of the variance
and, as shown in the loadings plot of Fig. 13.20 (bottom), it is dominated by positive
contributions of polystyrene (Fig. 13.20b). Notably, the negative contributions of
PC1 match well with the Raman features of lipids such as L-α-Phosphatidylcholine
(Fig. 13.20c) and also sphingomyelin (Fig. 13.20d). For comparison, the Raman
spectra of dNA (Fig. 13.20e) and RNA (Fig. 13.20f) are also shown, and it is clear
that they exhibit few or no similarities with PC1. high loadings of PC1 for cluster
5 are therefore an indication of the dominance of polystyrene. Positive loadings of
PC1 for some of Cluster 1 may indicate regions of overlap between the localised
nanoparticles and the surrounding cytoplasm, which, although they have significant
polystyrene contributions, are represented in the K-means cluster analysis by the
average spectrum of cluster 1.
Fig. 13.20 Top; Scatter plot of the PCA of spectra associated with clusters 1 ( Blue) and 5 ( Green).
Bottom; ( A) Loading of PC1 ( B) Raman Spectrum of polystyrene nanoparticles ( C) of L-αPhosphatidylcholine, ( D) of Sphingomyelin, ( E) of dNA and ( F) of RNA. (Reproduced from
[151])
H. J. Byrne et al.
nanopolystyrene can now be localised in the cytoplasm according to cluster 5, the
corresponding mean spectrum of which is presented in Fig. 13.19 IIIa. Although
some cellular features clearly contribute to the cluster spectrum, it is dominated
by specific features originating from polystyrene (Fig. 13.19 IIIb). K-means cluster analysis yields the average spectra for the identified clusters. these average
spectra can contain contributions from points on the boundaries between the cellular regions and a direct comparison does not always easily facilitate identification
of the differences in the biochemical composition. Cluster 5 clearly identifies the
presence of polystyrene nanoparticles localised in the cytoplasm, but the averaged
spectrum also exhibits clear contributions of the biological environment. PCA can
be employed to highlight the biochemical differences between the subcellular regions [150]. In Fig. 13.19 Ib, cluster 5 is predominantly surrounded by cytoplasmic
regions grouped within cluster 1. Figure 13.20 (top) is a scatter plot of the PCA of
spectra associated with K-means clusters 1 and 5. For visualisation purposes, spectra
associated with cluster 1 are coloured blue, while those from cluster 5 are coloured
green, and although the data is rather dispersed, some differentiation between the
two clusters according to PC1 is apparent. PC1 accounts for 61 % of the variance
and, as shown in the loadings plot of Fig. 13.20 (bottom), it is dominated by positive
contributions of polystyrene (Fig. 13.20b). Notably, the negative contributions of
PC1 match well with the Raman features of lipids such as L-α-Phosphatidylcholine
(Fig. 13.20c) and also sphingomyelin (Fig. 13.20d). For comparison, the Raman
spectra of dNA (Fig. 13.20e) and RNA (Fig. 13.20f) are also shown, and it is clear
that they exhibit few or no similarities with PC1. high loadings of PC1 for cluster
5 are therefore an indication of the dominance of polystyrene. Positive loadings of
PC1 for some of Cluster 1 may indicate regions of overlap between the localised
nanoparticles and the surrounding cytoplasm, which, although they have significant
polystyrene contributions, are represented in the K-means cluster analysis by the
average spectrum of cluster 1.
Fig. 13.20 Top; Scatter plot of the PCA of spectra associated with clusters 1 ( Blue) and 5 ( Green).
Bottom; ( A) Loading of PC1 ( B) Raman Spectrum of polystyrene nanoparticles ( C) of L-αPhosphatidylcholine, ( D) of Sphingomyelin, ( E) of dNA and ( F) of RNA. (Reproduced from
[151])