

389
13 Vibrational Spectroscopy: Disease Diagnostics and Beyond
K-means clustering, is a more specific probe to detect and localise nanoparticles
within cells [151]. Furthermore, Principal Component Analysis can be employed
to differentiate the local environment of the nanoparticles from the cytoplasm. For
convenience, formalin fixed (A549) cells were employed. Raman mapping was performed in immersion using a x100 olympus LumPlanF1 objective, a wavelength
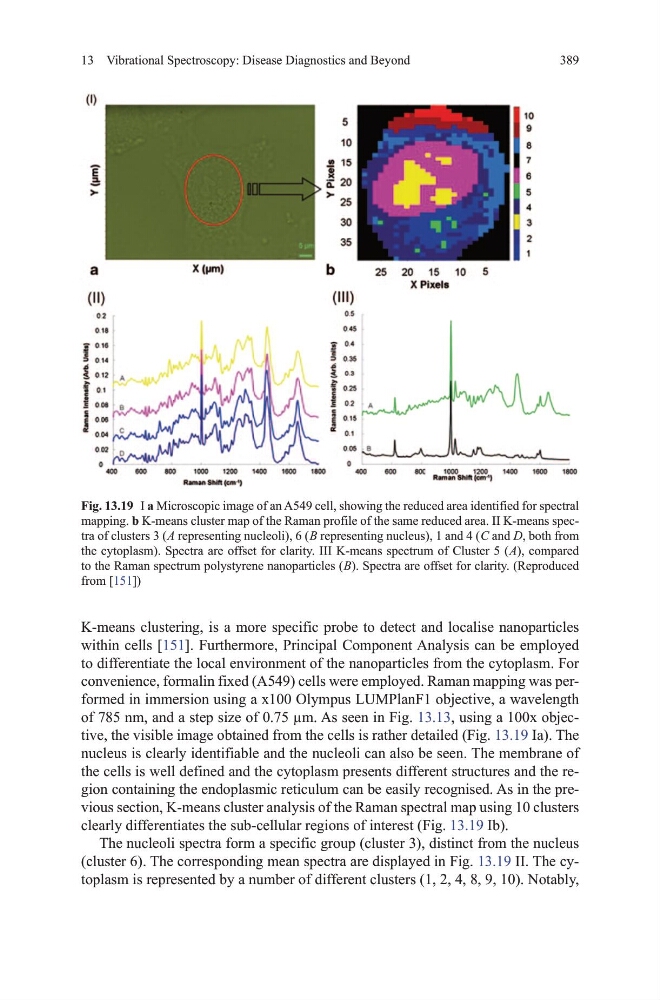
of 785 nm, and a step size of 0.75 µm. As seen in Fig. 13.13, using a 100x objective, the visible image obtained from the cells is rather detailed (Fig. 13.19 Ia). the
nucleus is clearly identifiable and the nucleoli can also be seen. the membrane of
the cells is well defined and the cytoplasm presents different structures and the region containing the endoplasmic reticulum can be easily recognised. As in the previous section, K-means cluster analysis of the Raman spectral map using 10 clusters
clearly differentiates the sub-cellular regions of interest (Fig. 13.19 Ib).
the nucleoli spectra form a specific group (cluster 3), distinct from the nucleus
(cluster 6). the corresponding mean spectra are displayed in Fig. 13.19 II. the cytoplasm is represented by a number of different clusters (1, 2, 4, 8, 9, 10). Notably,
Fig. 13.19 I a microscopic image of an A549 cell, showing the reduced area identified for spectral
mapping. b K-means cluster map of the Raman profile of the same reduced area. II K-means spectra of clusters 3 ( A representing nucleoli), 6 ( B representing nucleus), 1 and 4 ( C and D, both from
the cytoplasm). Spectra are offset for clarity. III K-means spectrum of Cluster 5 ( A), compared
to the Raman spectrum polystyrene nanoparticles ( B). Spectra are offset for clarity. (Reproduced
from [151])
13 Vibrational Spectroscopy: Disease Diagnostics and Beyond
K-means clustering, is a more specific probe to detect and localise nanoparticles
within cells [151]. Furthermore, Principal Component Analysis can be employed
to differentiate the local environment of the nanoparticles from the cytoplasm. For
convenience, formalin fixed (A549) cells were employed. Raman mapping was performed in immersion using a x100 olympus LumPlanF1 objective, a wavelength
of 785 nm, and a step size of 0.75 µm. As seen in Fig. 13.13, using a 100x objective, the visible image obtained from the cells is rather detailed (Fig. 13.19 Ia). the
nucleus is clearly identifiable and the nucleoli can also be seen. the membrane of
the cells is well defined and the cytoplasm presents different structures and the region containing the endoplasmic reticulum can be easily recognised. As in the previous section, K-means cluster analysis of the Raman spectral map using 10 clusters
clearly differentiates the sub-cellular regions of interest (Fig. 13.19 Ib).
the nucleoli spectra form a specific group (cluster 3), distinct from the nucleus
(cluster 6). the corresponding mean spectra are displayed in Fig. 13.19 II. the cytoplasm is represented by a number of different clusters (1, 2, 4, 8, 9, 10). Notably,
Fig. 13.19 I a microscopic image of an A549 cell, showing the reduced area identified for spectral
mapping. b K-means cluster map of the Raman profile of the same reduced area. II K-means spectra of clusters 3 ( A representing nucleoli), 6 ( B representing nucleus), 1 and 4 ( C and D, both from
the cytoplasm). Spectra are offset for clarity. III K-means spectrum of Cluster 5 ( A), compared
to the Raman spectrum polystyrene nanoparticles ( B). Spectra are offset for clarity. (Reproduced
from [151])