

366
H. J. Byrne et al.
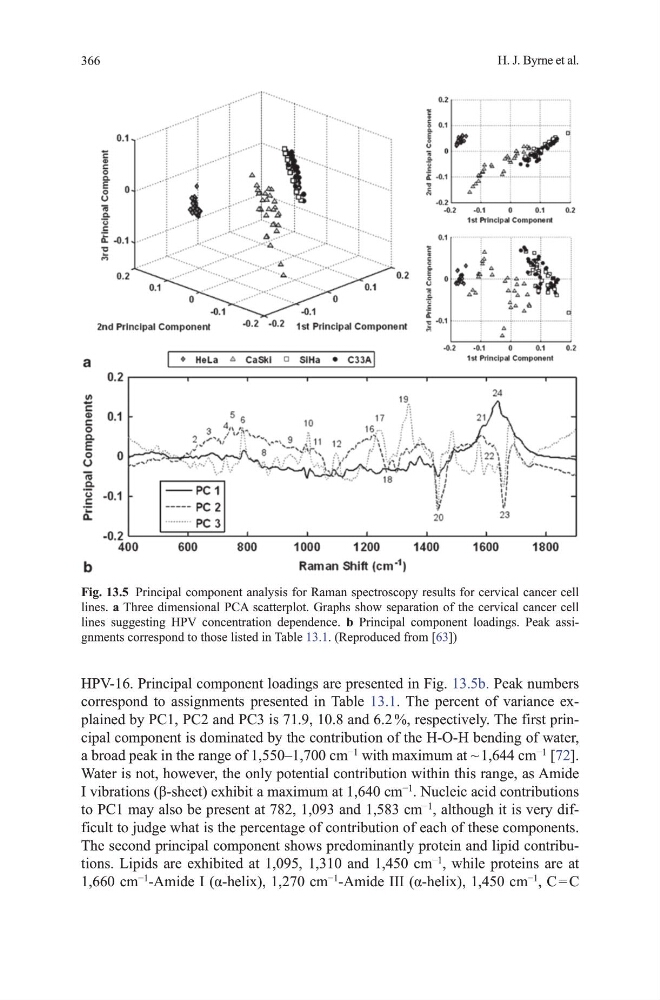
hPv-16. Principal component loadings are presented in Fig. 13.5b. Peak numbers
correspond to assignments presented in table 13.1. the percent of variance explained by PC1, PC2 and PC3 is 71.9, 10.8 and 6.2 %, respectively. the first principal component is dominated by the contribution of the h-o-h bending of water,
a broad peak in the range of 1,550–1,700 cm
−1
with maximum at ~ 1,644 cm
−1
[72].
Water is not, however, the only potential contribution within this range, as Amide
I vibrations (β-sheet) exhibit a maximum at 1,640 cm
−1
. Nucleic acid contributions
to PC1 may also be present at 782, 1,093 and 1,583 cm
−1
, although it is very difficult to judge what is the percentage of contribution of each of these components.
the second principal component shows predominantly protein and lipid contributions. Lipids are exhibited at 1,095, 1,310 and 1,450 cm
−1
, while proteins are at
1,660 cm
−1
-Amide I (α-helix), 1,270 cm
−1
-Amide III (α-helix), 1,450 cm
−1
, C = C
Fig. 13.5 Principal component analysis for Raman spectroscopy results for cervical cancer cell
lines. a three dimensional PCA scatterplot. graphs show separation of the cervical cancer cell
lines suggesting hPv concentration dependence. b Principal component loadings. Peak assignments correspond to those listed in table 13.1. (Reproduced from [63])
H. J. Byrne et al.
hPv-16. Principal component loadings are presented in Fig. 13.5b. Peak numbers
correspond to assignments presented in table 13.1. the percent of variance explained by PC1, PC2 and PC3 is 71.9, 10.8 and 6.2 %, respectively. the first principal component is dominated by the contribution of the h-o-h bending of water,
a broad peak in the range of 1,550–1,700 cm
−1
with maximum at ~ 1,644 cm
−1
[72].
Water is not, however, the only potential contribution within this range, as Amide
I vibrations (β-sheet) exhibit a maximum at 1,640 cm
−1
. Nucleic acid contributions
to PC1 may also be present at 782, 1,093 and 1,583 cm
−1
, although it is very difficult to judge what is the percentage of contribution of each of these components.
the second principal component shows predominantly protein and lipid contributions. Lipids are exhibited at 1,095, 1,310 and 1,450 cm
−1
, while proteins are at
1,660 cm
−1
-Amide I (α-helix), 1,270 cm
−1
-Amide III (α-helix), 1,450 cm
−1
, C = C
Fig. 13.5 Principal component analysis for Raman spectroscopy results for cervical cancer cell
lines. a three dimensional PCA scatterplot. graphs show separation of the cervical cancer cell
lines suggesting hPv concentration dependence. b Principal component loadings. Peak assignments correspond to those listed in table 13.1. (Reproduced from [63])