

365
13 Vibrational Spectroscopy: Disease Diagnostics and Beyond
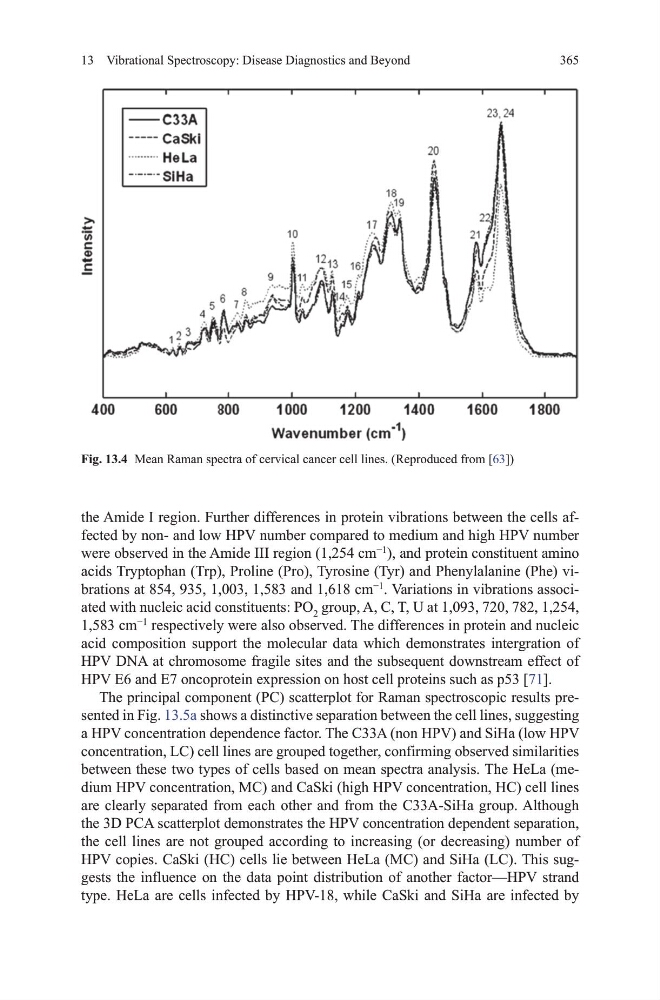
the Amide I region. Further differences in protein vibrations between the cells affected by non- and low hPv number compared to medium and high hPv number
were observed in the Amide III region (1,254 cm
−1
), and protein constituent amino
acids tryptophan (trp), Proline (Pro), tyrosine (tyr) and Phenylalanine (Phe) vibrations at 854, 935, 1,003, 1,583 and 1,618 cm
−1
. variations in vibrations associated with nucleic acid constituents: Po 2 group, A, C, t, u at 1,093, 720, 782, 1,254,
1,583 cm
−1
respectively were also observed. the differences in protein and nucleic
acid composition support the molecular data which demonstrates intergration of
hPv dNA at chromosome fragile sites and the subsequent downstream effect of
hPv E6 and E7 oncoprotein expression on host cell proteins such as p53 [71].
the principal component (PC) scatterplot for Raman spectroscopic results presented in Fig. 13.5a shows a distinctive separation between the cell lines, suggesting
a hPv concentration dependence factor. the C33A (non hPv) and Siha (low hPv
concentration, LC) cell lines are grouped together, confirming observed similarities
between these two types of cells based on mean spectra analysis. the heLa (medium hPv concentration, mC) and CaSki (high hPv concentration, hC) cell lines
are clearly separated from each other and from the C33A-Siha group. Although
the 3d PCA scatterplot demonstrates the hPv concentration dependent separation,
the cell lines are not grouped according to increasing (or decreasing) number of
hPv copies. CaSki (hC) cells lie between heLa (mC) and Siha (LC). this suggests the influence on the data point distribution of another factor—hPv strand
type. heLa are cells infected by hPv-18, while CaSki and Siha are infected by
Fig. 13.4 mean Raman spectra of cervical cancer cell lines. (Reproduced from [63])
13 Vibrational Spectroscopy: Disease Diagnostics and Beyond
the Amide I region. Further differences in protein vibrations between the cells affected by non- and low hPv number compared to medium and high hPv number
were observed in the Amide III region (1,254 cm
−1
), and protein constituent amino
acids tryptophan (trp), Proline (Pro), tyrosine (tyr) and Phenylalanine (Phe) vibrations at 854, 935, 1,003, 1,583 and 1,618 cm
−1
. variations in vibrations associated with nucleic acid constituents: Po 2 group, A, C, t, u at 1,093, 720, 782, 1,254,
1,583 cm
−1
respectively were also observed. the differences in protein and nucleic
acid composition support the molecular data which demonstrates intergration of
hPv dNA at chromosome fragile sites and the subsequent downstream effect of
hPv E6 and E7 oncoprotein expression on host cell proteins such as p53 [71].
the principal component (PC) scatterplot for Raman spectroscopic results presented in Fig. 13.5a shows a distinctive separation between the cell lines, suggesting
a hPv concentration dependence factor. the C33A (non hPv) and Siha (low hPv
concentration, LC) cell lines are grouped together, confirming observed similarities
between these two types of cells based on mean spectra analysis. the heLa (medium hPv concentration, mC) and CaSki (high hPv concentration, hC) cell lines
are clearly separated from each other and from the C33A-Siha group. Although
the 3d PCA scatterplot demonstrates the hPv concentration dependent separation,
the cell lines are not grouped according to increasing (or decreasing) number of
hPv copies. CaSki (hC) cells lie between heLa (mC) and Siha (LC). this suggests the influence on the data point distribution of another factor—hPv strand
type. heLa are cells infected by hPv-18, while CaSki and Siha are infected by
Fig. 13.4 mean Raman spectra of cervical cancer cell lines. (Reproduced from [63])