

347
12.3.3 Component Identification by the Correlation Function
In what follows we present examples of qualitative analysis of mixtures of solid
amino acids using as templates the experimentally measured Raman spectra of
the components. We assume the linear model of the spectrum of a mixture, which
means that it is a linear combination of some number of non-interacting component
spectra. We try to find the optimum scaling coefficients of the combination maximizing the correlation function between measured and reconstructed spectra:
( ( )
( ))( ( )
( ))
( )
( )
,
R w
E R M w
E M
R E R
M E M
L
i
L
k
i
k
L
L
k
k
i
−
−
−
−
=
∑
1
981
(12.1)
where:
R
ca L
L
l
l L
l
=
⊂
…
∈
∑ , {, , , , }
1 2 3
20
reconstructed spectrum;
a l
l
,
, ,
= 1
20
…
template spectrum number l (see table 12.1);
M k
a b c
t
k ,
, , , ,
∈
…
{
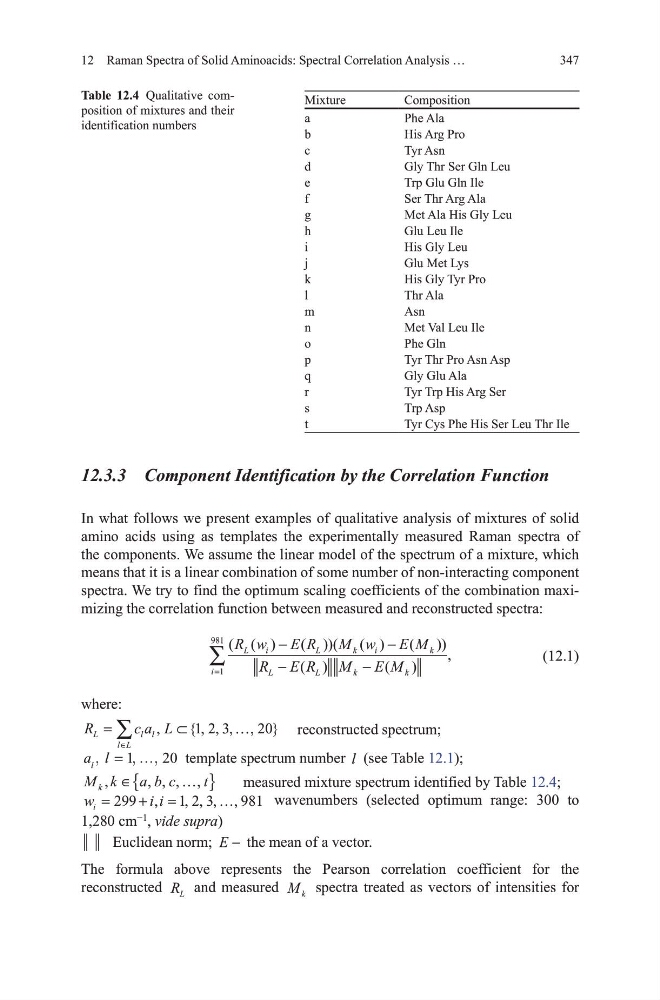
} measured mixture spectrum identified by table 12.4;
w
ii
i =
+ =
…
299
1 2 3
981
,
, , , ,
wavenumbers (selected optimum range: 300 to
1,280 cm
−1
, vide supra)
Euclidean norm; E - the mean of a vector.
the formula above represents the Pearson correlation coefficient for the
reconstructed R L and measured M k spectra treated as vectors of intensities for
12 Raman Spectra of Solid Aminoacids: Spectral Correlation Analysis …
mixture
Composition
a
Phe Ala
b
his Arg Pro
c
tyr Asn
d
gly thr Ser gln Leu
e
trp glu gln Ile
f
Ser thr Arg Ala
g
met Ala his gly Leu
h
glu Leu Ile
i
his gly Leu
j
glu met Lys
k
his gly tyr Pro
l
thr Ala
m
Asn
n
met val Leu Ile
o
Phe gln
p
tyr thr Pro Asn Asp
q
gly glu Ala
r
tyr trp his Arg Ser
s
trp Asp
t
tyr Cys Phe his Ser Leu thr Ile
Table 12.4 Qualitative composition of mixtures and their
identification numbers
12.3.3 Component Identification by the Correlation Function
In what follows we present examples of qualitative analysis of mixtures of solid
amino acids using as templates the experimentally measured Raman spectra of
the components. We assume the linear model of the spectrum of a mixture, which
means that it is a linear combination of some number of non-interacting component
spectra. We try to find the optimum scaling coefficients of the combination maximizing the correlation function between measured and reconstructed spectra:
( ( )
( ))( ( )
( ))
( )
( )
,
R w
E R M w
E M
R E R
M E M
L
i
L
k
i
k
L
L
k
k
i
−
−
−
−
=
∑
1
981
(12.1)
where:
R
ca L
L
l
l L
l
=
⊂
…
∈
∑ , {, , , , }
1 2 3
20
reconstructed spectrum;
a l
l
,
, ,
= 1
20
…
template spectrum number l (see table 12.1);
M k
a b c
t
k ,
, , , ,
∈
…
{
} measured mixture spectrum identified by table 12.4;
w
ii
i =
+ =
…
299
1 2 3
981
,
, , , ,
wavenumbers (selected optimum range: 300 to
1,280 cm
−1
, vide supra)
Euclidean norm; E - the mean of a vector.
the formula above represents the Pearson correlation coefficient for the
reconstructed R L and measured M k spectra treated as vectors of intensities for
12 Raman Spectra of Solid Aminoacids: Spectral Correlation Analysis …
mixture
Composition
a
Phe Ala
b
his Arg Pro
c
tyr Asn
d
gly thr Ser gln Leu
e
trp glu gln Ile
f
Ser thr Arg Ala
g
met Ala his gly Leu
h
glu Leu Ile
i
his gly Leu
j
glu met Lys
k
his gly tyr Pro
l
thr Ala
m
Asn
n
met val Leu Ile
o
Phe gln
p
tyr thr Pro Asn Asp
q
gly glu Ala
r
tyr trp his Arg Ser
s
trp Asp
t
tyr Cys Phe his Ser Leu thr Ile
Table 12.4 Qualitative composition of mixtures and their
identification numbers