

346
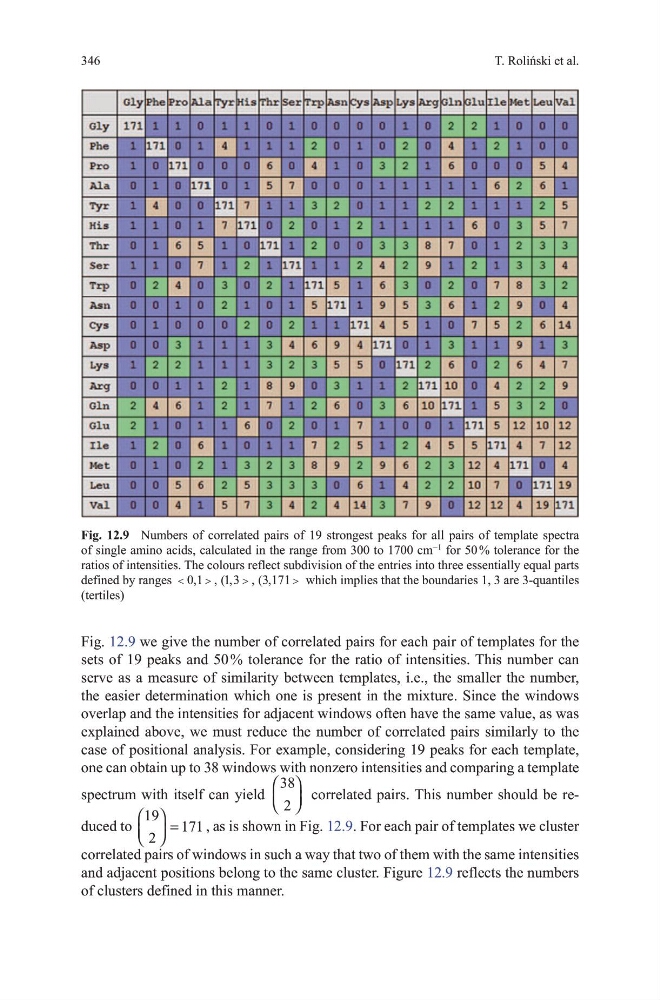
Fig. 12.9 we give the number of correlated pairs for each pair of templates for the
sets of 19 peaks and 50 % tolerance for the ratio of intensities. this number can
serve as a measure of similarity between templates, i.e., the smaller the number,
the easier determination which one is present in the mixture. Since the windows
overlap and the intensities for adjacent windows often have the same value, as was
explained above, we must reduce the number of correlated pairs similarly to the
case of positional analysis. For example, considering 19 peaks for each template,
one can obtain up to 38 windows with nonzero intensities and comparing a template
spectrum with itself can yield
38
2
correlated pairs. this number should be reduced to
19
2
171
=
, as is shown in Fig. 12.9. For each pair of templates we cluster
correlated pairs of windows in such a way that two of them with the same intensities
and adjacent positions belong to the same cluster. Figure 12.9 reflects the numbers
of clusters defined in this manner.
T. Roliński et al.
Fig. 12.9 Numbers of correlated pairs of 19 strongest peaks for all pairs of template spectra
of single amino acids, calculated in the range from 300 to 1700 cm
−1
for 50 % tolerance for the
ratios of intensities. the colours reflect subdivision of the entries into three essentially equal parts
defined by ranges
0 1
1 3
3 171
, , ( , , ( ,
which implies that the boundaries 1, 3 are 3-quantiles
(tertiles)
Fig. 12.9 we give the number of correlated pairs for each pair of templates for the
sets of 19 peaks and 50 % tolerance for the ratio of intensities. this number can
serve as a measure of similarity between templates, i.e., the smaller the number,
the easier determination which one is present in the mixture. Since the windows
overlap and the intensities for adjacent windows often have the same value, as was
explained above, we must reduce the number of correlated pairs similarly to the
case of positional analysis. For example, considering 19 peaks for each template,
one can obtain up to 38 windows with nonzero intensities and comparing a template
spectrum with itself can yield
38
2
correlated pairs. this number should be reduced to
19
2
171
=
, as is shown in Fig. 12.9. For each pair of templates we cluster
correlated pairs of windows in such a way that two of them with the same intensities
and adjacent positions belong to the same cluster. Figure 12.9 reflects the numbers
of clusters defined in this manner.
T. Roliński et al.
Fig. 12.9 Numbers of correlated pairs of 19 strongest peaks for all pairs of template spectra
of single amino acids, calculated in the range from 300 to 1700 cm
−1
for 50 % tolerance for the
ratios of intensities. the colours reflect subdivision of the entries into three essentially equal parts
defined by ranges
0 1
1 3
3 171
, , ( , , ( ,
which implies that the boundaries 1, 3 are 3-quantiles
(tertiles)