

344
have a series of windows with intensities that form a simplified spectrum. the width
of each window is 8 cm
−1
; it is related to our experimental resolution. In Fig. 12.7
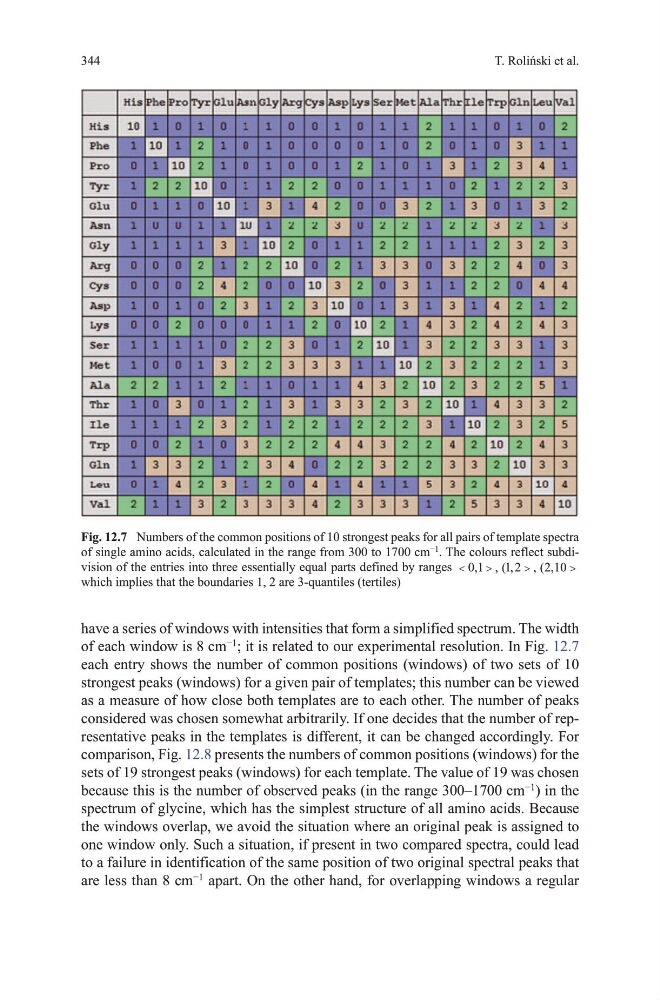
each entry shows the number of common positions (windows) of two sets of 10
strongest peaks (windows) for a given pair of templates; this number can be viewed
as a measure of how close both templates are to each other. the number of peaks
considered was chosen somewhat arbitrarily. If one decides that the number of representative peaks in the templates is different, it can be changed accordingly. For
comparison, Fig. 12.8 presents the numbers of common positions (windows) for the
sets of 19 strongest peaks (windows) for each template. the value of 19 was chosen
because this is the number of observed peaks (in the range 300–1700 cm
−1
) in the
spectrum of glycine, which has the simplest structure of all amino acids. Because
the windows overlap, we avoid the situation where an original peak is assigned to
one window only. Such a situation, if present in two compared spectra, could lead
to a failure in identification of the same position of two original spectral peaks that
are less than 8 cm
−1
apart. on the other hand, for overlapping windows a regular
T. Roliński et al.
Fig. 12.7 Numbers of the common positions of 10 strongest peaks for all pairs of template spectra
of single amino acids, calculated in the range from 300 to 1700 cm
−1
. the colours reflect subdivision of the entries into three essentially equal parts defined by ranges
0 1
1 2
2 10
, , ( ,
, ( ,
which implies that the boundaries 1, 2 are 3-quantiles (tertiles)
have a series of windows with intensities that form a simplified spectrum. the width
of each window is 8 cm
−1
; it is related to our experimental resolution. In Fig. 12.7
each entry shows the number of common positions (windows) of two sets of 10
strongest peaks (windows) for a given pair of templates; this number can be viewed
as a measure of how close both templates are to each other. the number of peaks
considered was chosen somewhat arbitrarily. If one decides that the number of representative peaks in the templates is different, it can be changed accordingly. For
comparison, Fig. 12.8 presents the numbers of common positions (windows) for the
sets of 19 strongest peaks (windows) for each template. the value of 19 was chosen
because this is the number of observed peaks (in the range 300–1700 cm
−1
) in the
spectrum of glycine, which has the simplest structure of all amino acids. Because
the windows overlap, we avoid the situation where an original peak is assigned to
one window only. Such a situation, if present in two compared spectra, could lead
to a failure in identification of the same position of two original spectral peaks that
are less than 8 cm
−1
apart. on the other hand, for overlapping windows a regular
T. Roliński et al.
Fig. 12.7 Numbers of the common positions of 10 strongest peaks for all pairs of template spectra
of single amino acids, calculated in the range from 300 to 1700 cm
−1
. the colours reflect subdivision of the entries into three essentially equal parts defined by ranges
0 1
1 2
2 10
, , ( ,
, ( ,
which implies that the boundaries 1, 2 are 3-quantiles (tertiles)