

343
in the mixture this is an indication of the presence of a component in the mixture.
Let us consider, for example, 10 strongest peaks in each template. then, if a peak
is present in the mixture spectrum we can assign some number of points to the
corresponding amino acid, and in the case of absence—minus some other number
of points. Let us note that for only 10 strongest peaks considered the absence of
a peak in the mixture spectrum is a stronger sign than the presence and should be
properly weighted. In this way we apply scoring to each amino acid and can sort
them accordingly. In order to decide if a component is present in the mixture we
must assume a certain threshold level for the scores. obviously, the absence of the
strongest peak in the mixture is a stronger negative sign than the absence of the
tenth strongest peak. thus, we can refine the scoring, giving more weight to the first
case. Let us note that if a given pair of template spectra has many strong peaks that
are close to each other, one may be in doubt which corresponding amino acid is part
of the mixture. to find out which pairs of templates can cause such confusion, we
determined the number of common positions of 10 strongest peaks for each pair of
template spectra. We first defined a series of overlapping windows (300 + 4n cm
−1
;
308 + 4n cm
−1
), n = 0, 1, 2, …, 349, covering the whole considered spectral range
from 300 cm
−1
to 1700 cm
−1
. For each template spectrum we looked for peaks within successive windows and assigned the intensity of the strongest one to them. If
there was no peak in the corresponding window, we put zero intensity to it. thus, we
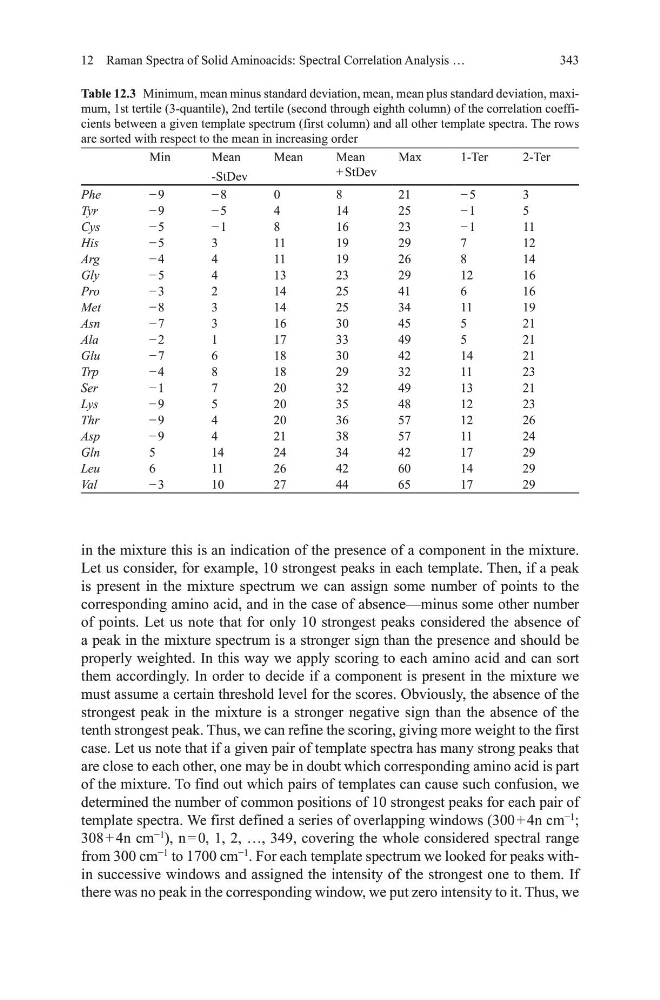
Table 12.3 minimum, mean minus standard deviation, mean, mean plus standard deviation, maximum, 1st tertile (3-quantile), 2nd tertile (second through eighth column) of the correlation coefficients between a given template spectrum (first column) and all other template spectra. the rows
are sorted with respect to the mean in increasing order
min
mean
-Stdev
mean
mean
+ Stdev
max
1-ter
2-ter
Phe
− 9
− 8
0
8
21
− 5
3
Tyr
− 9
− 5
4
14
25
− 1
5
Cys
− 5
− 1
8
16
23
− 1
11
His
− 5
3
11
19
29
7
12
Arg
− 4
4
11
19
26
8
14
Gly
− 5
4
13
23
29
12
16
Pro
− 3
2
14
25
41
6
16
Met
− 8
3
14
25
34
11
19
Asn
− 7
3
16
30
45
5
21
Ala
− 2
1
17
33
49
5
21
Glu
− 7
6
18
30
42
14
21
Trp
− 4
8
18
29
32
11
23
Ser
− 1
7
20
32
49
13
21
Lys
− 9
5
20
35
48
12
23
Thr
− 9
4
20
36
57
12
26
Asp
− 9
4
21
38
57
11
24
Gln
5
14
24
34
42
17
29
Leu
6
11
26
42
60
14
29
Val
− 3
10
27
44
65
17
29
12 Raman Spectra of Solid Aminoacids: Spectral Correlation Analysis …
in the mixture this is an indication of the presence of a component in the mixture.
Let us consider, for example, 10 strongest peaks in each template. then, if a peak
is present in the mixture spectrum we can assign some number of points to the
corresponding amino acid, and in the case of absence—minus some other number
of points. Let us note that for only 10 strongest peaks considered the absence of
a peak in the mixture spectrum is a stronger sign than the presence and should be
properly weighted. In this way we apply scoring to each amino acid and can sort
them accordingly. In order to decide if a component is present in the mixture we
must assume a certain threshold level for the scores. obviously, the absence of the
strongest peak in the mixture is a stronger negative sign than the absence of the
tenth strongest peak. thus, we can refine the scoring, giving more weight to the first
case. Let us note that if a given pair of template spectra has many strong peaks that
are close to each other, one may be in doubt which corresponding amino acid is part
of the mixture. to find out which pairs of templates can cause such confusion, we
determined the number of common positions of 10 strongest peaks for each pair of
template spectra. We first defined a series of overlapping windows (300 + 4n cm
−1
;
308 + 4n cm
−1
), n = 0, 1, 2, …, 349, covering the whole considered spectral range
from 300 cm
−1
to 1700 cm
−1
. For each template spectrum we looked for peaks within successive windows and assigned the intensity of the strongest one to them. If
there was no peak in the corresponding window, we put zero intensity to it. thus, we
Table 12.3 minimum, mean minus standard deviation, mean, mean plus standard deviation, maximum, 1st tertile (3-quantile), 2nd tertile (second through eighth column) of the correlation coefficients between a given template spectrum (first column) and all other template spectra. the rows
are sorted with respect to the mean in increasing order
min
mean
-Stdev
mean
mean
+ Stdev
max
1-ter
2-ter
Phe
− 9
− 8
0
8
21
− 5
3
Tyr
− 9
− 5
4
14
25
− 1
5
Cys
− 5
− 1
8
16
23
− 1
11
His
− 5
3
11
19
29
7
12
Arg
− 4
4
11
19
26
8
14
Gly
− 5
4
13
23
29
12
16
Pro
− 3
2
14
25
41
6
16
Met
− 8
3
14
25
34
11
19
Asn
− 7
3
16
30
45
5
21
Ala
− 2
1
17
33
49
5
21
Glu
− 7
6
18
30
42
14
21
Trp
− 4
8
18
29
32
11
23
Ser
− 1
7
20
32
49
13
21
Lys
− 9
5
20
35
48
12
23
Thr
− 9
4
20
36
57
12
26
Asp
− 9
4
21
38
57
11
24
Gln
5
14
24
34
42
17
29
Leu
6
11
26
42
60
14
29
Val
− 3
10
27
44
65
17
29
12 Raman Spectra of Solid Aminoacids: Spectral Correlation Analysis …