

317
11.3 Carotenoids in Higher Plant and Single Animal Cells
Apart from the fact that β-carotene is found commonly in higher plants, it is also
accumulated in various animal cells. Raman spectroscopy was used to investigate
of this carotenoid both in plant [39, 40] and animal cells of several different systems
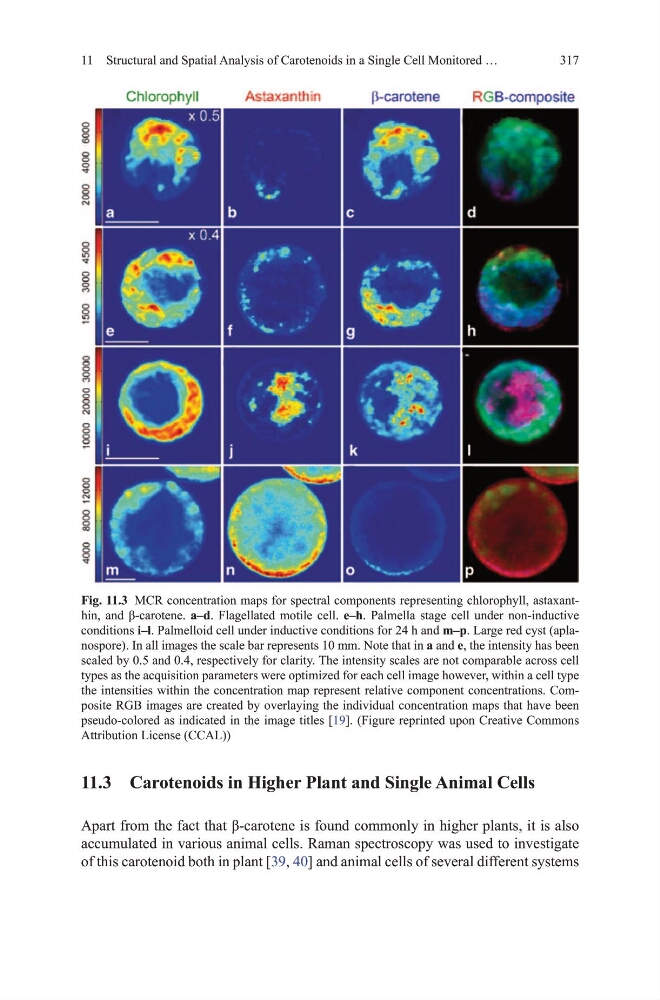
Fig. 11.3 mCR concentration maps for spectral components representing chlorophyll, astaxanthin, and β-carotene. a–d. Flagellated motile cell. e–h. Palmella stage cell under non-inductive
conditions i–l. Palmelloid cell under inductive conditions for 24 h and m–p. Large red cyst (aplanospore). In all images the scale bar represents 10 mm. Note that in a and e, the intensity has been
scaled by 0.5 and 0.4, respectively for clarity. the intensity scales are not comparable across cell
types as the acquisition parameters were optimized for each cell image however, within a cell type
the intensities within the concentration map represent relative component concentrations. Composite RgB images are created by overlaying the individual concentration maps that have been
pseudo-colored as indicated in the image titles [19]. (Figure reprinted upon Creative Commons
Attribution License (CCAL))
11 Structural and Spatial Analysis of Carotenoids in a Single Cell monitored …
11.3 Carotenoids in Higher Plant and Single Animal Cells
Apart from the fact that β-carotene is found commonly in higher plants, it is also
accumulated in various animal cells. Raman spectroscopy was used to investigate
of this carotenoid both in plant [39, 40] and animal cells of several different systems
Fig. 11.3 mCR concentration maps for spectral components representing chlorophyll, astaxanthin, and β-carotene. a–d. Flagellated motile cell. e–h. Palmella stage cell under non-inductive
conditions i–l. Palmelloid cell under inductive conditions for 24 h and m–p. Large red cyst (aplanospore). In all images the scale bar represents 10 mm. Note that in a and e, the intensity has been
scaled by 0.5 and 0.4, respectively for clarity. the intensity scales are not comparable across cell
types as the acquisition parameters were optimized for each cell image however, within a cell type
the intensities within the concentration map represent relative component concentrations. Composite RgB images are created by overlaying the individual concentration maps that have been
pseudo-colored as indicated in the image titles [19]. (Figure reprinted upon Creative Commons
Attribution License (CCAL))
11 Structural and Spatial Analysis of Carotenoids in a Single Cell monitored …