

315
(PLS) were used to classify obtained Raman spectra of individual cells. With the
applied pre-processing procedures, PLS resulted in much better overall classification than SImCA, particularly when the second derivative using the Savitzky-golay
algorithm was applied. It was demonstrated that the last procedure was fully capable to extract chemical differences between cells grown in two mentioned nutrient conditions. As it is confirmed by the average spectra of nitrogen-replete and
nitrogen-starved cells, the chlorophyll a bands are more intense in the nitrogenreplete population of cells compared to β-carotene bands, while the reverse effect is
observed for nitrogen-starved cells [13]. Classification of the nitrogen-starved and
replete Dunaliella tertiolecta cells was further improved by the analysis of mean
spectra obtained from at least four individual spectra acquired at 2 µm intervals
across the longitudinal axis of each cell (100 and 90 % of N-starved and N-replete
cells, respectively, classified correctly) [14]. It was demonstrated that the analysis
of first two PC loadings allowed for finding of the exact spectral features related to
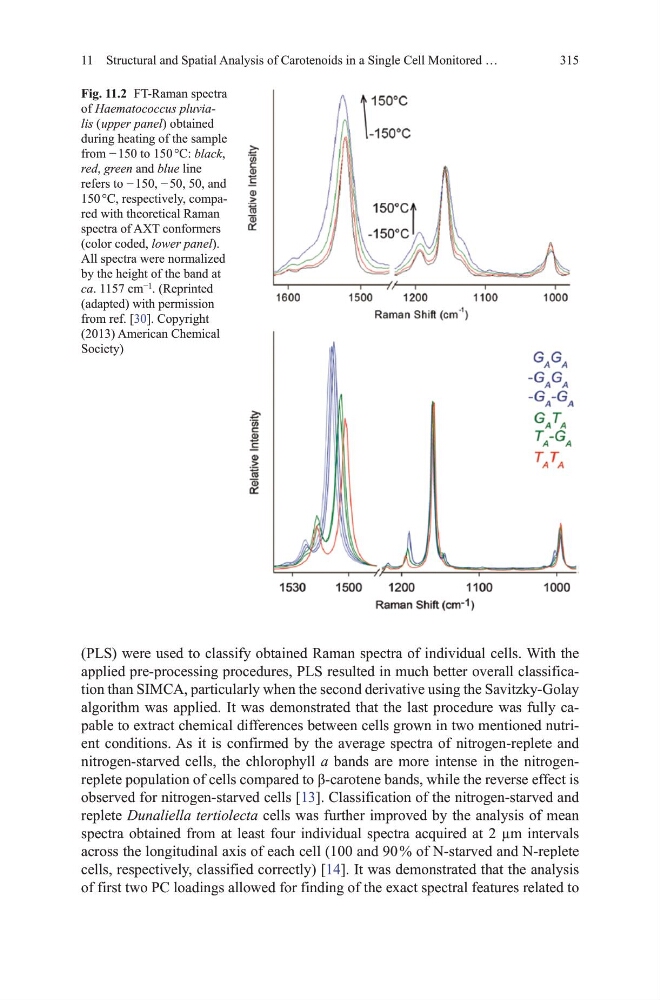
Fig. 11.2 Ft-Raman spectra
of Haematococcus pluvialis ( upper panel) obtained
during heating of the sample
from − 150 to 150 °C: black,
red, green and blue line
refers to − 150, − 50, 50, and
150 °C, respectively, compared with theoretical Raman
spectra of AXt conformers
(color coded, lower panel).
All spectra were normalized
by the height of the band at
ca. 1157 cm −1 . (Reprinted
(adapted) with permission
from ref. [30]. Copyright
(2013) American Chemical
Society)
11 Structural and Spatial Analysis of Carotenoids in a Single Cell monitored …
(PLS) were used to classify obtained Raman spectra of individual cells. With the
applied pre-processing procedures, PLS resulted in much better overall classification than SImCA, particularly when the second derivative using the Savitzky-golay
algorithm was applied. It was demonstrated that the last procedure was fully capable to extract chemical differences between cells grown in two mentioned nutrient conditions. As it is confirmed by the average spectra of nitrogen-replete and
nitrogen-starved cells, the chlorophyll a bands are more intense in the nitrogenreplete population of cells compared to β-carotene bands, while the reverse effect is
observed for nitrogen-starved cells [13]. Classification of the nitrogen-starved and
replete Dunaliella tertiolecta cells was further improved by the analysis of mean
spectra obtained from at least four individual spectra acquired at 2 µm intervals
across the longitudinal axis of each cell (100 and 90 % of N-starved and N-replete
cells, respectively, classified correctly) [14]. It was demonstrated that the analysis
of first two PC loadings allowed for finding of the exact spectral features related to
Fig. 11.2 Ft-Raman spectra
of Haematococcus pluvialis ( upper panel) obtained
during heating of the sample
from − 150 to 150 °C: black,
red, green and blue line
refers to − 150, − 50, 50, and
150 °C, respectively, compared with theoretical Raman
spectra of AXt conformers
(color coded, lower panel).
All spectra were normalized
by the height of the band at
ca. 1157 cm −1 . (Reprinted
(adapted) with permission
from ref. [30]. Copyright
(2013) American Chemical
Society)
11 Structural and Spatial Analysis of Carotenoids in a Single Cell monitored …