

A. Rygula and P. Miskowiec
302
Simultaneously, the carotenoids distribution was determined. It is known, that
carotenoids act as a plant protector and follow abiotic stress like was demonstrated
here, so it was not surprising that those group of dyes was detected.
A very intense Raman signal for indigo pigment enables to analyse it in situ
without any problems. the same marker band as for mapping, near 1,573 cm
−1
,
was used for developing the quantification protocols for the in situ determination of
indigo in Polygonum tinctorium [111]. the analysis was carried out with Ft-Raman
spectrometer and hPLC technique as a reference method. the studies of the indigo
determination by AtR FtIR spectroscopy did not give any positive results, mainly
because of the overlapping of the IR indigo spectrum by the signals of the other
plant components e.g. cellulose. In case of Ft-RS, indigo signal is so intense that
cellulose bands are hardly observed [41, 111].
the first successful synthesis of a synthetic indigo was performed in 1880 by A.
von Bayern and since 1897 the commercial production, based on the K. heumann’s
synthesis route, were developed [112]. therefore, especially in the conservation of
art textiles, the identification of synthetic or natural indigo enables proper dating of
the art objects.
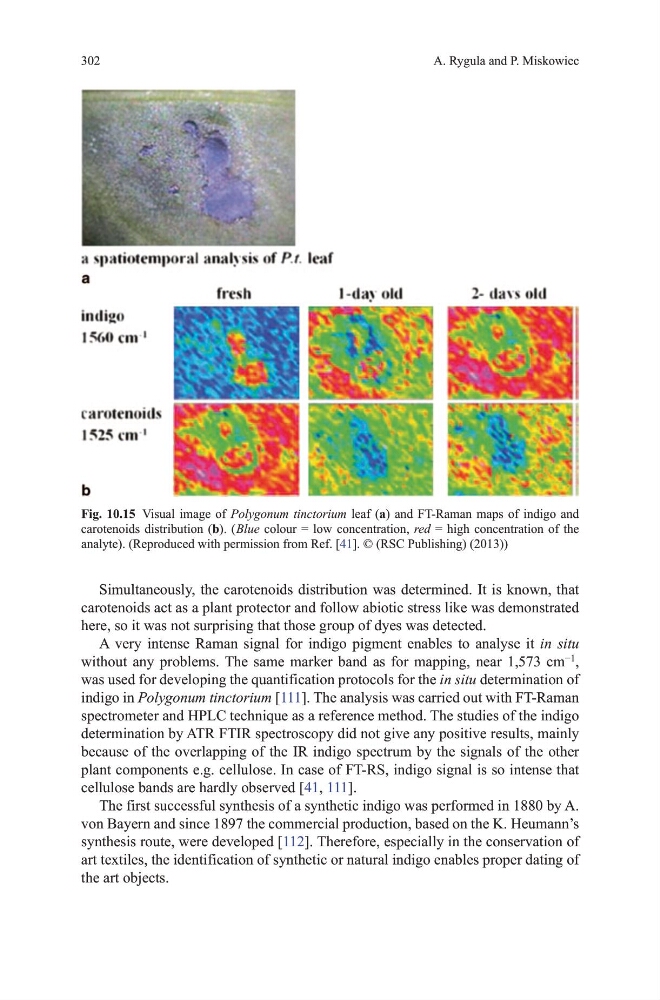
Fig. 10.15 visual image of Polygonum tinctorium leaf (a) and Ft-Raman maps of indigo and
carotenoids distribution (b). ( Blue colour = low concentration, red = high concentration of the
analyte). (Reproduced with permission from Ref. [41]. © (RSC Publishing) (2013))
302
Simultaneously, the carotenoids distribution was determined. It is known, that
carotenoids act as a plant protector and follow abiotic stress like was demonstrated
here, so it was not surprising that those group of dyes was detected.
A very intense Raman signal for indigo pigment enables to analyse it in situ
without any problems. the same marker band as for mapping, near 1,573 cm
−1
,
was used for developing the quantification protocols for the in situ determination of
indigo in Polygonum tinctorium [111]. the analysis was carried out with Ft-Raman
spectrometer and hPLC technique as a reference method. the studies of the indigo
determination by AtR FtIR spectroscopy did not give any positive results, mainly
because of the overlapping of the IR indigo spectrum by the signals of the other
plant components e.g. cellulose. In case of Ft-RS, indigo signal is so intense that
cellulose bands are hardly observed [41, 111].
the first successful synthesis of a synthetic indigo was performed in 1880 by A.
von Bayern and since 1897 the commercial production, based on the K. heumann’s
synthesis route, were developed [112]. therefore, especially in the conservation of
art textiles, the identification of synthetic or natural indigo enables proper dating of
the art objects.
Fig. 10.15 visual image of Polygonum tinctorium leaf (a) and Ft-Raman maps of indigo and
carotenoids distribution (b). ( Blue colour = low concentration, red = high concentration of the
analyte). (Reproduced with permission from Ref. [41]. © (RSC Publishing) (2013))