

A. Rygula and P. Miskowiec
296
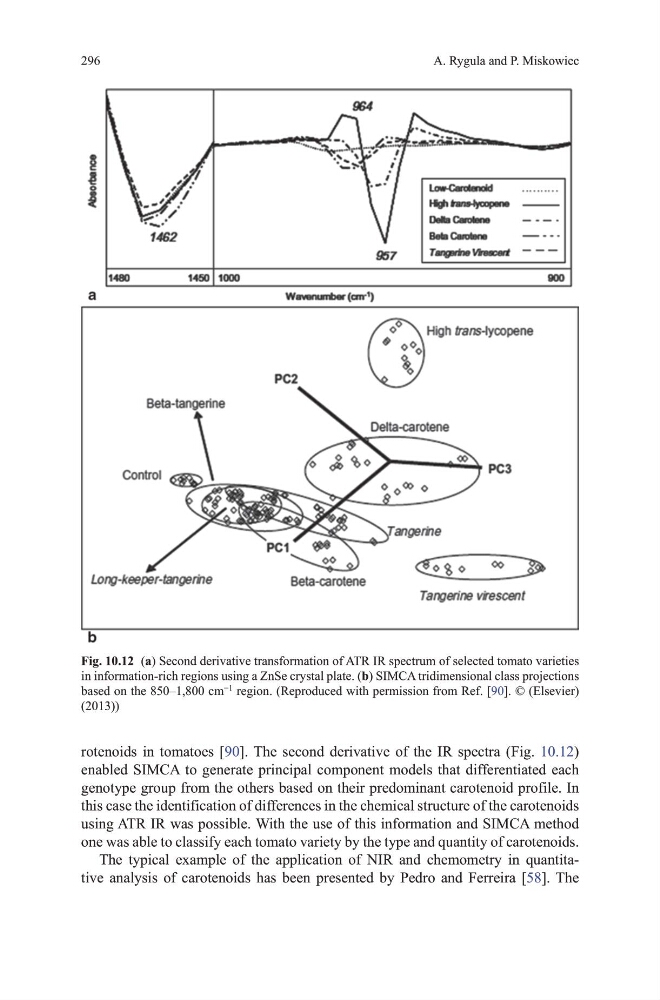
rotenoids in tomatoes [90]. the second derivative of the IR spectra (Fig. 10.12)
enabled SImCA to generate principal component models that differentiated each
genotype group from the others based on their predominant carotenoid profile. In
this case the identification of differences in the chemical structure of the carotenoids
using AtR IR was possible. With the use of this information and SImCA method
one was able to classify each tomato variety by the type and quantity of carotenoids.
the typical example of the application of NIR and chemometry in quantitative analysis of carotenoids has been presented by Pedro and Ferreira [58]. the
Fig. 10.12 (a) Second derivative transformation of AtR IR spectrum of selected tomato varieties
in information-rich regions using a ZnSe crystal plate. (b) SImCA tridimensional class projections
based on the 850–1,800 cm
−1
region. (Reproduced with permission from Ref. [90]. © (Elsevier)
(2013))
296
rotenoids in tomatoes [90]. the second derivative of the IR spectra (Fig. 10.12)
enabled SImCA to generate principal component models that differentiated each
genotype group from the others based on their predominant carotenoid profile. In
this case the identification of differences in the chemical structure of the carotenoids
using AtR IR was possible. With the use of this information and SImCA method
one was able to classify each tomato variety by the type and quantity of carotenoids.
the typical example of the application of NIR and chemometry in quantitative analysis of carotenoids has been presented by Pedro and Ferreira [58]. the
Fig. 10.12 (a) Second derivative transformation of AtR IR spectrum of selected tomato varieties
in information-rich regions using a ZnSe crystal plate. (b) SImCA tridimensional class projections
based on the 850–1,800 cm
−1
region. (Reproduced with permission from Ref. [90]. © (Elsevier)
(2013))