

10 Chemometric Analysis of Raman and IR Spectra of Natural Dyes
295
using AtR IR method. It is worth to notice, that the best model was obtained in the
limited spectral range (650–1,800 cm
−1
) because since above 1,800 cm
−1
IR spectra
were disturbed by Co 2 absorption.
however, the properties of biological samples often causes that analysis of natural dyes in many cases is difficult and sometimes even impossible. For example,
the calibration and cross-validation of PLS models obtained by AtR IR spectroscopy for carotenoids technique in apricot flesh are shown in the work of Ruiz [89].
After testing of the different wavelength intervals, the spectral range from 940 to
1,200 cm
−1
was selected for developing the prediction models. unfortunately, the
mid-IR models showed a high validation error (table 10.2).
the prediction of carotenoids content in apricot turned out not possible by using
mid-IR method, probably because of low relative intensity of absorption bands as
compared to major compounds such as sugars and acids.
AtR IR combined with a different chemometric method like SImCA (soft independent modeling by class analogy)—a multivariate analysis technique, which
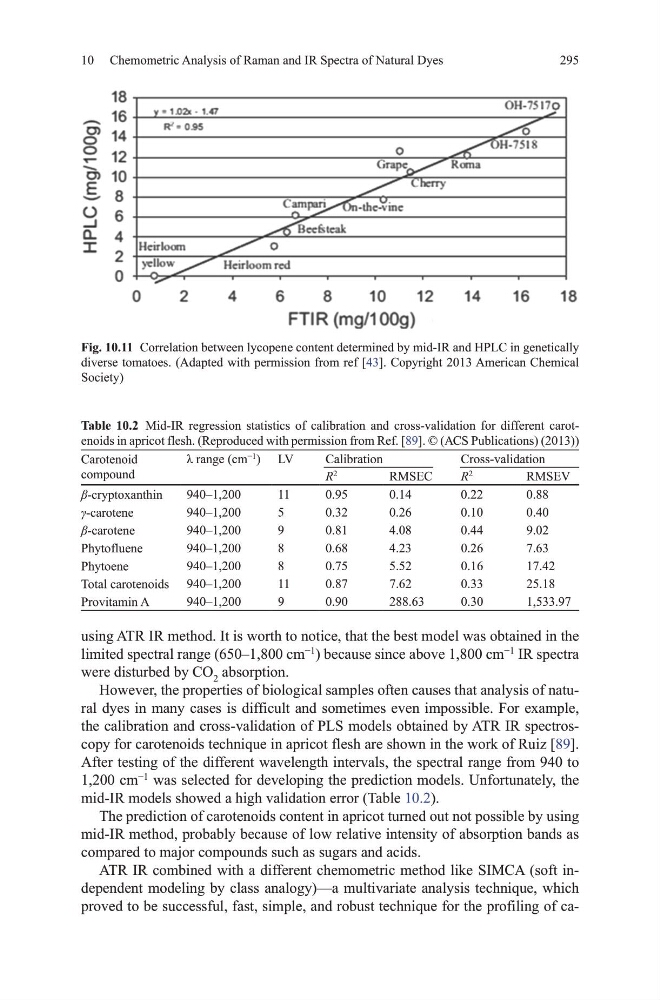
proved to be successful, fast, simple, and robust technique for the profiling of caFig. 10.11 Correlation between lycopene content determined by mid-IR and hPLC in genetically
diverse tomatoes. (Adapted with permission from ref [43]. Copyright 2013 American Chemical
Society)
Table 10.2 mid-IR regression statistics of calibration and cross-validation for different carotenoids in apricot flesh. (Reproduced with permission from Ref. [89]. © (ACS Publications) (2013))
Carotenoid
compound
λ range (cm
−1
) Lv
Calibration
Cross-validation
R
2
RmSEC
R
2
RmSEv
β-cryptoxanthin
940–1,200
11
0.95
0.14
0.22
0.88
γ-carotene
940–1,200
5
0.32
0.26
0.10
0.40
β-carotene
940–1,200
9
0.81
4.08
0.44
9.02
Phytofluene
940–1,200
8
0.68
4.23
0.26
7.63
Phytoene
940–1,200
8
0.75
5.52
0.16
17.42
total carotenoids 940–1,200
11
0.87
7.62
0.33
25.18
Provitamin A
940–1,200
9
0.90
288.63
0.30
1,533.97
295
using AtR IR method. It is worth to notice, that the best model was obtained in the
limited spectral range (650–1,800 cm
−1
) because since above 1,800 cm
−1
IR spectra
were disturbed by Co 2 absorption.
however, the properties of biological samples often causes that analysis of natural dyes in many cases is difficult and sometimes even impossible. For example,
the calibration and cross-validation of PLS models obtained by AtR IR spectroscopy for carotenoids technique in apricot flesh are shown in the work of Ruiz [89].
After testing of the different wavelength intervals, the spectral range from 940 to
1,200 cm
−1
was selected for developing the prediction models. unfortunately, the
mid-IR models showed a high validation error (table 10.2).
the prediction of carotenoids content in apricot turned out not possible by using
mid-IR method, probably because of low relative intensity of absorption bands as
compared to major compounds such as sugars and acids.
AtR IR combined with a different chemometric method like SImCA (soft independent modeling by class analogy)—a multivariate analysis technique, which
proved to be successful, fast, simple, and robust technique for the profiling of caFig. 10.11 Correlation between lycopene content determined by mid-IR and hPLC in genetically
diverse tomatoes. (Adapted with permission from ref [43]. Copyright 2013 American Chemical
Society)
Table 10.2 mid-IR regression statistics of calibration and cross-validation for different carotenoids in apricot flesh. (Reproduced with permission from Ref. [89]. © (ACS Publications) (2013))
Carotenoid
compound
λ range (cm
−1
) Lv
Calibration
Cross-validation
R
2
RmSEC
R
2
RmSEv
β-cryptoxanthin
940–1,200
11
0.95
0.14
0.22
0.88
γ-carotene
940–1,200
5
0.32
0.26
0.10
0.40
β-carotene
940–1,200
9
0.81
4.08
0.44
9.02
Phytofluene
940–1,200
8
0.68
4.23
0.26
7.63
Phytoene
940–1,200
8
0.75
5.52
0.16
17.42
total carotenoids 940–1,200
11
0.87
7.62
0.33
25.18
Provitamin A
940–1,200
9
0.90
288.63
0.30
1,533.97