

10 Chemometric Analysis of Raman and IR Spectra of Natural Dyes
293
demonstrated [83]. As a reference methods hPLC and uv-vis spectroscopy were
used. the model in the spectral region 1,700 cm
−1
–955 cm
−1
showed the best correlation coefficient. According to the authors, the models can be used as a tool for
rapid screening of quality in saffron samples. moreover, RS gives better results and
is more adequate than NIR spectroscopy for the study of saffron carotenoids.
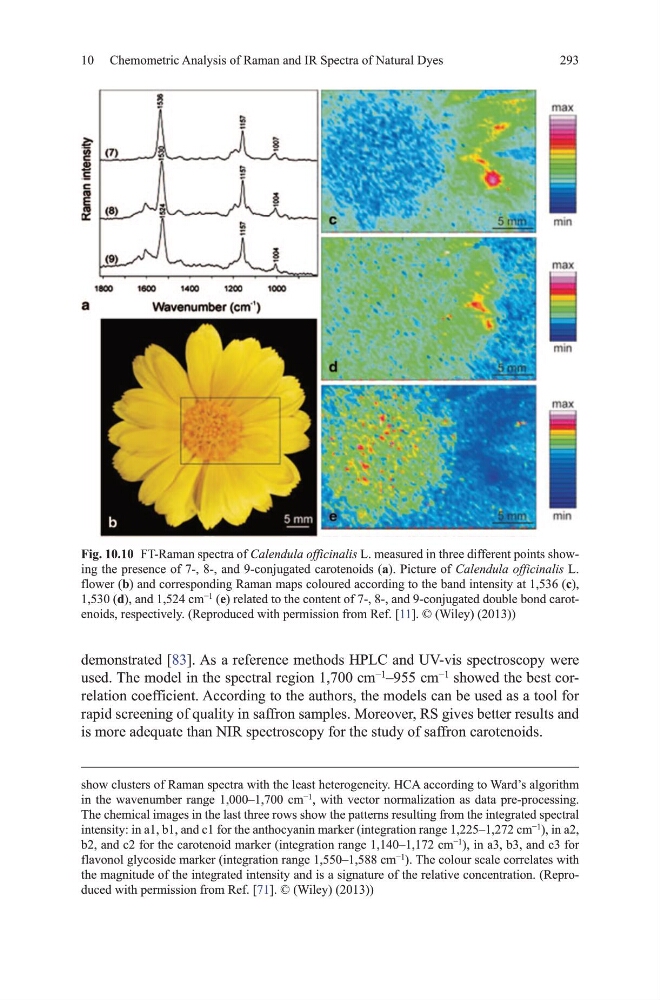
Fig. 10.10 Ft-Raman spectra of Calendula officinalis L. measured in three different points showing the presence of 7-, 8-, and 9-conjugated carotenoids (a). Picture of Calendula officinalis L.
flower (b) and corresponding Raman maps coloured according to the band intensity at 1,536 (c),
1,530 (d), and 1,524 cm
−1
(e) related to the content of 7-, 8-, and 9-conjugated double bond carotenoids, respectively. (Reproduced with permission from Ref. [11]. © (Wiley) (2013))
show clusters of Raman spectra with the least heterogeneity. hCA according to Ward’s algorithm
in the wavenumber range 1,000–1,700 cm
−1
, with vector normalization as data pre-processing.
the chemical images in the last three rows show the patterns resulting from the integrated spectral
intensity: in a1, b1, and c1 for the anthocyanin marker (integration range 1,225–1,272 cm
−1
), in a2,
b2, and c2 for the carotenoid marker (integration range 1,140–1,172 cm
−1
), in a3, b3, and c3 for
flavonol glycoside marker (integration range 1,550–1,588 cm
−1
). the colour scale correlates with
the magnitude of the integrated intensity and is a signature of the relative concentration. (Reproduced with permission from Ref. [71]. © (Wiley) (2013))
293
demonstrated [83]. As a reference methods hPLC and uv-vis spectroscopy were
used. the model in the spectral region 1,700 cm
−1
–955 cm
−1
showed the best correlation coefficient. According to the authors, the models can be used as a tool for
rapid screening of quality in saffron samples. moreover, RS gives better results and
is more adequate than NIR spectroscopy for the study of saffron carotenoids.
Fig. 10.10 Ft-Raman spectra of Calendula officinalis L. measured in three different points showing the presence of 7-, 8-, and 9-conjugated carotenoids (a). Picture of Calendula officinalis L.
flower (b) and corresponding Raman maps coloured according to the band intensity at 1,536 (c),
1,530 (d), and 1,524 cm
−1
(e) related to the content of 7-, 8-, and 9-conjugated double bond carotenoids, respectively. (Reproduced with permission from Ref. [11]. © (Wiley) (2013))
show clusters of Raman spectra with the least heterogeneity. hCA according to Ward’s algorithm
in the wavenumber range 1,000–1,700 cm
−1
, with vector normalization as data pre-processing.
the chemical images in the last three rows show the patterns resulting from the integrated spectral
intensity: in a1, b1, and c1 for the anthocyanin marker (integration range 1,225–1,272 cm
−1
), in a2,
b2, and c2 for the carotenoid marker (integration range 1,140–1,172 cm
−1
), in a3, b3, and c3 for
flavonol glycoside marker (integration range 1,550–1,588 cm
−1
). the colour scale correlates with
the magnitude of the integrated intensity and is a signature of the relative concentration. (Reproduced with permission from Ref. [71]. © (Wiley) (2013))