

A. Rygula and P. Miskowiec
292
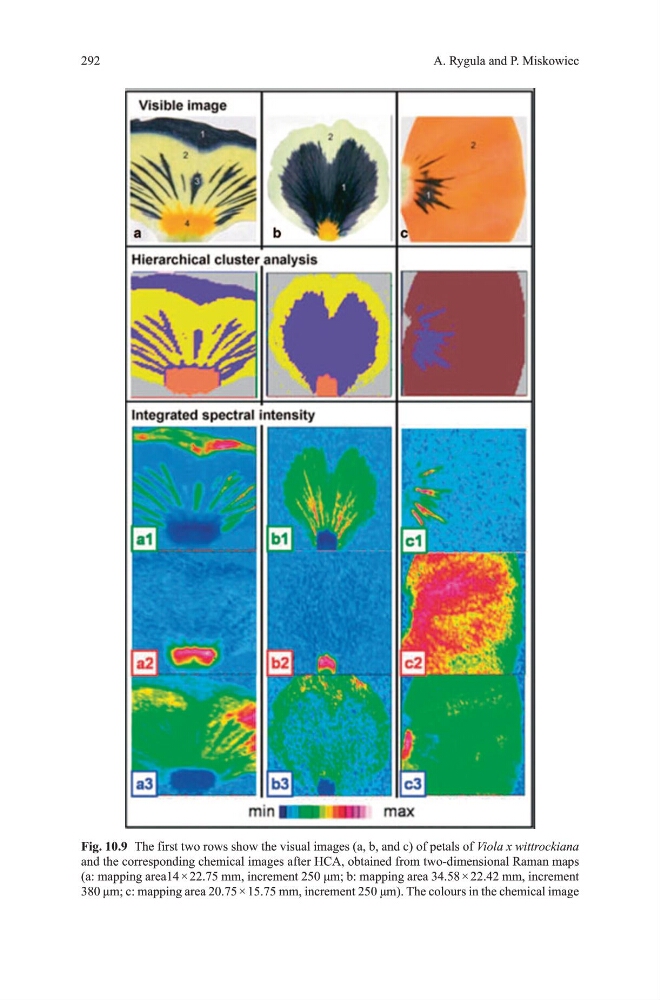
Fig. 10.9 the first two rows show the visual images (a, b, and c) of petals of Viola x wittrockiana
and the corresponding chemical images after hCA, obtained from two-dimensional Raman maps
(a: mapping area14 × 22.75 mm, increment 250 μm; b: mapping area 34.58 × 22.42 mm, increment
380 μm; c: mapping area 20.75 × 15.75 mm, increment 250 μm). The colours in the chemical image
292
Fig. 10.9 the first two rows show the visual images (a, b, and c) of petals of Viola x wittrockiana
and the corresponding chemical images after hCA, obtained from two-dimensional Raman maps
(a: mapping area14 × 22.75 mm, increment 250 μm; b: mapping area 34.58 × 22.42 mm, increment
380 μm; c: mapping area 20.75 × 15.75 mm, increment 250 μm). The colours in the chemical image