

10 Chemometric Analysis of Raman and IR Spectra of Natural Dyes
287
shapes with few sharp peaks. For other typical NIR spectra of various color fruits
see [54].
obviously, the analytical information contained in the broad, extensively overlapped bands of NIR spectra is hardly selective and multivariate in nature. In addition, differences between samples may cause very slight spectral differences that
are difficult to distinguish. this similarity is the reason why the sophisticated multivariate chemometrics techniques are essential to extract useful information from
NIR spectrum and to perform qualitative or quantitative NIR analysis. to extract
analytically important and reduce irrelevant information the following pretreatment
mathematical methods are used practically in every NIR analysis, including dyes:
• Multiplicative scatter correction (MSC) and standard normal variate (SNV)
• Reduction of variables by principal component analysis
to do any further quantitative analysis the spectrometer has to be calibrated using
multivariate methods, which are similar to those used in mid-IR spectroscopy. the
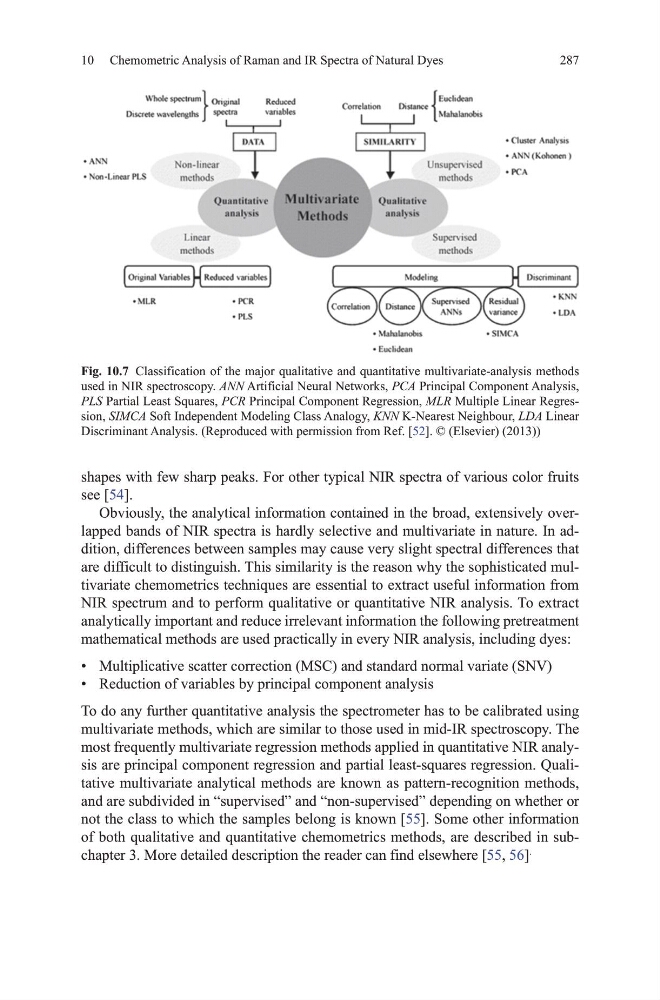
most frequently multivariate regression methods applied in quantitative NIR analysis are principal component regression and partial least-squares regression. Qualitative multivariate analytical methods are known as pattern-recognition methods,
and are subdivided in “supervised” and “non-supervised” depending on whether or
not the class to which the samples belong is known [55]. Some other information
of both qualitative and quantitative chemometrics methods, are described in subchapter 3. more detailed description the reader can find elsewhere [55, 56]
.
Fig. 10.7 Classification of the major qualitative and quantitative multivariate-analysis methods
used in NIR spectroscopy. ANN Artificial Neural Networks, PCA Principal Component Analysis,
PLS Partial Least Squares, PCR Principal Component Regression, MLR multiple Linear Regression, SIMCA Soft Independent modeling Class Analogy, KNN K-Nearest Neighbour, LDA Linear
discriminant Analysis. (Reproduced with permission from Ref. [52]. © (Elsevier) (2013))
287
shapes with few sharp peaks. For other typical NIR spectra of various color fruits
see [54].
obviously, the analytical information contained in the broad, extensively overlapped bands of NIR spectra is hardly selective and multivariate in nature. In addition, differences between samples may cause very slight spectral differences that
are difficult to distinguish. this similarity is the reason why the sophisticated multivariate chemometrics techniques are essential to extract useful information from
NIR spectrum and to perform qualitative or quantitative NIR analysis. to extract
analytically important and reduce irrelevant information the following pretreatment
mathematical methods are used practically in every NIR analysis, including dyes:
• Multiplicative scatter correction (MSC) and standard normal variate (SNV)
• Reduction of variables by principal component analysis
to do any further quantitative analysis the spectrometer has to be calibrated using
multivariate methods, which are similar to those used in mid-IR spectroscopy. the
most frequently multivariate regression methods applied in quantitative NIR analysis are principal component regression and partial least-squares regression. Qualitative multivariate analytical methods are known as pattern-recognition methods,
and are subdivided in “supervised” and “non-supervised” depending on whether or
not the class to which the samples belong is known [55]. Some other information
of both qualitative and quantitative chemometrics methods, are described in subchapter 3. more detailed description the reader can find elsewhere [55, 56]
.
Fig. 10.7 Classification of the major qualitative and quantitative multivariate-analysis methods
used in NIR spectroscopy. ANN Artificial Neural Networks, PCA Principal Component Analysis,
PLS Partial Least Squares, PCR Principal Component Regression, MLR multiple Linear Regression, SIMCA Soft Independent modeling Class Analogy, KNN K-Nearest Neighbour, LDA Linear
discriminant Analysis. (Reproduced with permission from Ref. [52]. © (Elsevier) (2013))