

2 Integrating Optical Spectroscopy and Chemometric Methods
17
A
cl
λ
λ
ε
=
(2.1)
A λ
absorbance at a given wavelength, expressed in nanometers,
ε λ
the molar extinction coefficient at a given wavelength,
c
molar concentration of compound,
l
optical path length expressed in centimeters
the first steps of these operations include: baseline correction and dilution correction. Several techniques applied to perform baseline correction are summarized by
Kohler et al. [5].
obtain, corrected and transformed results are organize into matrix X, presented
in table 2.1 consists n rows (wavelengths, λ) and m columns (spectra obtained for
the m increasing concentrations of the compound or spectra registered at different
temperatures, ph, etc.). Each element of this matrix corresponds to extinction values calculated for each sample in following wavelengths.
For each column of matrix, the mean values and standard deviation values can
be calculated for whole range of wavelengths or for selected range of wavelength,
for example range characteristic for research chromophore. these two parameters
can be used for measuring changes in intensity of the spectra [3, 4]. to minimalize
influence of changes in intensity of spectra, and in this way study only changes into
its shapes, sets of spectra should be transformed. the most popular transformations
are centring and autoscaling.
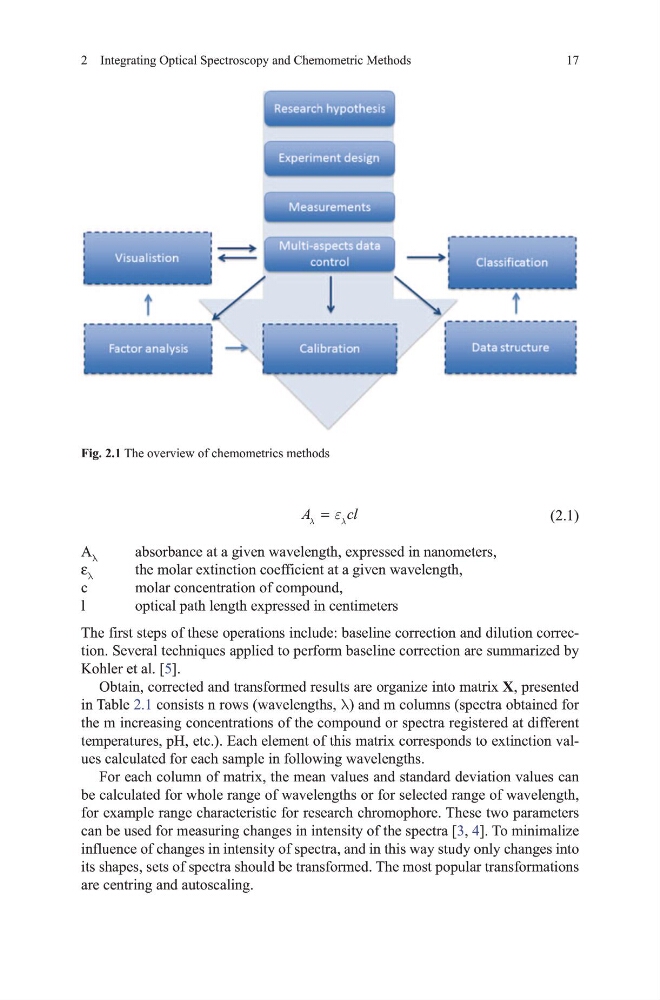
Fig. 2.1 the overview of chemometrics methods
17
A
cl
λ
λ
ε
=
(2.1)
A λ
absorbance at a given wavelength, expressed in nanometers,
ε λ
the molar extinction coefficient at a given wavelength,
c
molar concentration of compound,
l
optical path length expressed in centimeters
the first steps of these operations include: baseline correction and dilution correction. Several techniques applied to perform baseline correction are summarized by
Kohler et al. [5].
obtain, corrected and transformed results are organize into matrix X, presented
in table 2.1 consists n rows (wavelengths, λ) and m columns (spectra obtained for
the m increasing concentrations of the compound or spectra registered at different
temperatures, ph, etc.). Each element of this matrix corresponds to extinction values calculated for each sample in following wavelengths.
For each column of matrix, the mean values and standard deviation values can
be calculated for whole range of wavelengths or for selected range of wavelength,
for example range characteristic for research chromophore. these two parameters
can be used for measuring changes in intensity of the spectra [3, 4]. to minimalize
influence of changes in intensity of spectra, and in this way study only changes into
its shapes, sets of spectra should be transformed. the most popular transformations
are centring and autoscaling.
Fig. 2.1 the overview of chemometrics methods