

217
8 Two-Dimensional Mid-Infrared Correlation Spectroscopy in Protein Research
troscopy methods: mid-IR [36–89], near-IR [36, 38, 90–99], vibrational circular
dichroism (vCd) [43, 100, 101], electronic circular dichroism (ECd) [41, 102],
Raman [40, 41, 103–107], Raman optical activity (RoA) [105, 107–111], deep uv
resonance Raman (duvRR) [28, 31, 32, 112–114], and fluorescence [115–118].
most of these applications use mid-infrared spectroscopy, and this use explains the
general popularity of this method in the investigation of different quantitative problems in biomolecular systems.
A few reviews devoted to the application of Raman, near- and mid-IR 2dCoS to
protein research were given in [32, 119–121] along with detailed descriptions of the
background and of the computational procedures. Additionally, in chapter 12 in the
text book [1], the authors focus on infrared 2dCoS as a powerful tool in the examination of three selected protein systems. the most recent review of the application
of vibrational 2DCoS to biological compounds was provided by Ozaki and Šašic
[122] where results from [52] were presented in detail.
8.3.1 Pretreatment stage of 2DCoS analysis
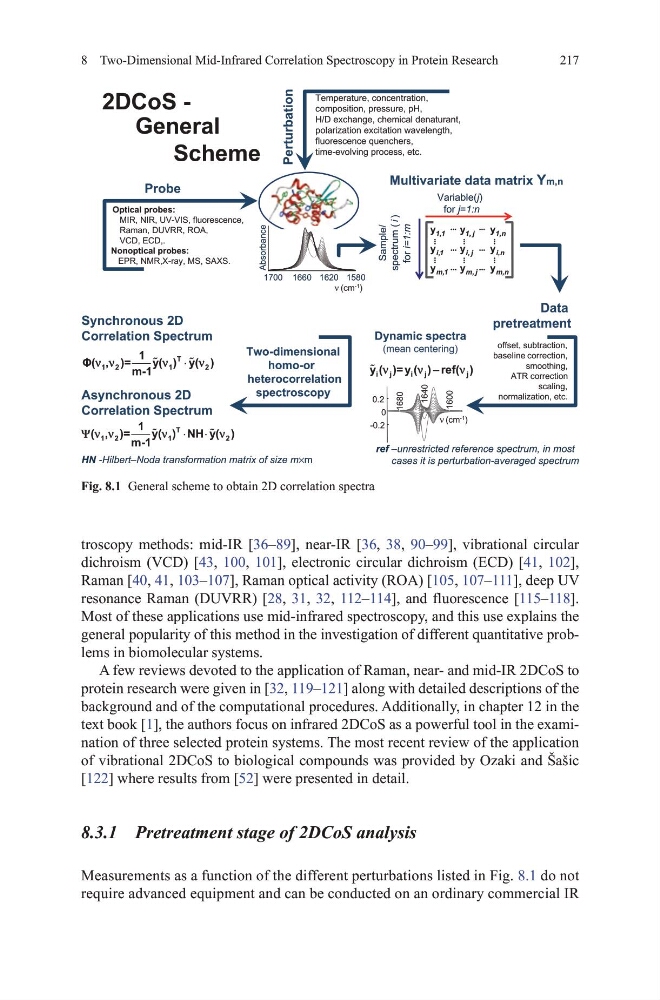
measurements as a function of the different perturbations listed in Fig. 8.1 do not
require advanced equipment and can be conducted on an ordinary commercial IR
$EVRUEDQFH
ν FP
*HQHUDO
6FKHPH
3HUWXUEDWLRQ
7HPSHUDWXUHFRQFHQWUDWLRQ
FRPSRVLWLRQSUHVVXUHS+
+'H[FKDQJHFKHPLFDOGHQDWXUDQW
SRODUL]DWLRQH[FLWDWLRQZDYHOHQJWK
IOXRUHVFHQFHTXHQFKHUV
WLPHHYROYLQJSURFHVVHWF
2SWLFDOSUREHV
0,51,5899,6IOXRUHVFHQFH
5DPDQ'895552$
9&'(&'
1RQRSWLFDOSUREHV
(35105;UD\066$;6
7ZRGLPHQVLRQDO
KRPRRU
KHWHURFRUUHODWLRQ
VSHFWURVFRS\
7
\ \
P
ν ν
ν ⋅ ν
7
\ 1+ \
P
Ψ ν ν
ν ⋅
⋅ ν
'DWD
SUHWUHDWPHQW
'\QDPLFVSHFWUD
PHDQFHQWHULQJ
L
M
L
M
M
\ \ UHI
ν
ν −
ν
9DULDEOHM
IRUM Q
6DPSOH
VSHFWUXP L
IRUL P
\
\
\
\
\
\
\
\
\
M
Q
L
L M
LQ
P
P M
PQ
0XOWLYDULDWHGDWDPDWUL[
EDVHOLQH FRUUHFWLRQ
VPRRWKLQJ
$75FRUUHFWLRQ
VFDOLQJ
QRUPDOL]DWLRQHWF
3UREH
6\QFKURQRXV'
&RUUHODWLRQ6SHFWUXP
$V\QFKURQRXV'
&RUUHODWLRQ6SHFWUXP
+1 +LOEHUW±1RGDWUDQVIRUPDWLRQPDWUL[RIVL]HP×P
UHI ±XQUHVWULFWHGUHIHUHQFHVSHFWUXPLQPRVW
FDVHVLWLVSHUWXUEDWLRQDYHUDJHGVSHFWUXP
ν FP
'&R6
Fig. 8.1 general scheme to obtain 2d correlation spectra
8 Two-Dimensional Mid-Infrared Correlation Spectroscopy in Protein Research
troscopy methods: mid-IR [36–89], near-IR [36, 38, 90–99], vibrational circular
dichroism (vCd) [43, 100, 101], electronic circular dichroism (ECd) [41, 102],
Raman [40, 41, 103–107], Raman optical activity (RoA) [105, 107–111], deep uv
resonance Raman (duvRR) [28, 31, 32, 112–114], and fluorescence [115–118].
most of these applications use mid-infrared spectroscopy, and this use explains the
general popularity of this method in the investigation of different quantitative problems in biomolecular systems.
A few reviews devoted to the application of Raman, near- and mid-IR 2dCoS to
protein research were given in [32, 119–121] along with detailed descriptions of the
background and of the computational procedures. Additionally, in chapter 12 in the
text book [1], the authors focus on infrared 2dCoS as a powerful tool in the examination of three selected protein systems. the most recent review of the application
of vibrational 2DCoS to biological compounds was provided by Ozaki and Šašic
[122] where results from [52] were presented in detail.
8.3.1 Pretreatment stage of 2DCoS analysis
measurements as a function of the different perturbations listed in Fig. 8.1 do not
require advanced equipment and can be conducted on an ordinary commercial IR
$EVRUEDQFH
ν FP
*HQHUDO
6FKHPH
3HUWXUEDWLRQ
7HPSHUDWXUHFRQFHQWUDWLRQ
FRPSRVLWLRQSUHVVXUHS+
+'H[FKDQJHFKHPLFDOGHQDWXUDQW
SRODUL]DWLRQH[FLWDWLRQZDYHOHQJWK
IOXRUHVFHQFHTXHQFKHUV
WLPHHYROYLQJSURFHVVHWF
2SWLFDOSUREHV
0,51,5899,6IOXRUHVFHQFH
5DPDQ'895552$
9&'(&'
1RQRSWLFDOSUREHV
(35105;UD\066$;6
7ZRGLPHQVLRQDO
KRPRRU
KHWHURFRUUHODWLRQ
VSHFWURVFRS\
7
\ \
P
ν ν
ν ⋅ ν
7
\ 1+ \
P
Ψ ν ν
ν ⋅
⋅ ν
'DWD
SUHWUHDWPHQW
'\QDPLFVSHFWUD
PHDQFHQWHULQJ
L
M
L
M
M
\ \ UHI
ν
ν −
ν
9DULDEOHM
IRUM Q
6DPSOH
VSHFWUXP L
IRUL P
\
\
\
\
\
\
\
\
\
M
Q
L
L M
LQ
P
P M
PQ
0XOWLYDULDWHGDWDPDWUL[
EDVHOLQH FRUUHFWLRQ
VPRRWKLQJ
$75FRUUHFWLRQ
VFDOLQJ
QRUPDOL]DWLRQHWF
3UREH
6\QFKURQRXV'
&RUUHODWLRQ6SHFWUXP
$V\QFKURQRXV'
&RUUHODWLRQ6SHFWUXP
+1 +LOEHUW±1RGDWUDQVIRUPDWLRQPDWUL[RIVL]HP×P
UHI ±XQUHVWULFWHGUHIHUHQFHVSHFWUXPLQPRVW
FDVHVLWLVSHUWXUEDWLRQDYHUDJHGVSHFWUXP
ν FP
'&R6
Fig. 8.1 general scheme to obtain 2d correlation spectra