

198
R. Fausto and N. Kuş
1680
1670
1195
1185
0.00
0.02
750
740
1760
1740
0.00
0.02
0.04
AH2 + AO
AO
IO2
IO2
IO2
IO2
IO1
IO1
IO1
IO1
IO1
IO1
AO
IO2
Absorbance
Wavenumber / cm
-1
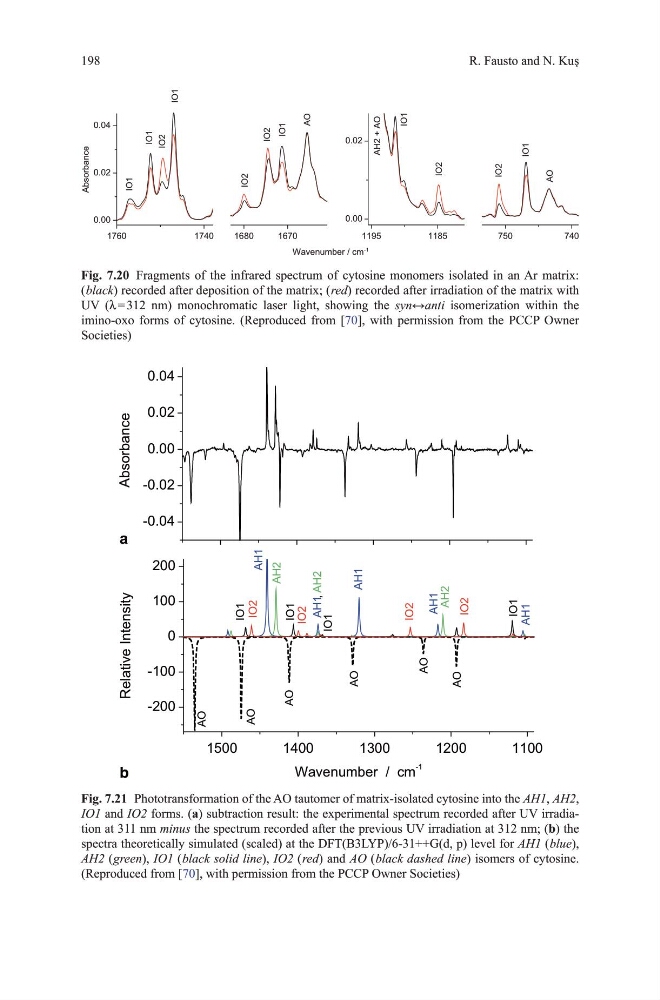
Fig. 7.20 Fragments of the infrared spectrum of cytosine monomers isolated in an Ar matrix:
( black) recorded after deposition of the matrix; ( red) recorded after irradiation of the matrix with
uv (λ = 312 nm) monochromatic laser light, showing the syn↔anti isomerization within the
imino-oxo forms of cytosine. (Reproduced from [70], with permission from the PCCP owner
Societies)
1500
1400
1300
1200
1100
-200
-100
0
100
200
-0.04
-0.02
0.00
0.02
0.04
AH2
AH1
AH1
AH2
AH1, AH2
AH1
IO2
IO2
IO2
IO2
IO1
IO1
IO1
AO
AO
AO
AO
AO
Relative Intensity
Wavenumber / cm
-1
AO
IO1
AH1
b
Absorbance
a
Fig. 7.21 Phototransformation of the Ao tautomer of matrix-isolated cytosine into the AH1, AH2,
IO1 and IO2 forms. (a) subtraction result: the experimental spectrum recorded after uv irradiation at 311 nm minus the spectrum recorded after the previous uv irradiation at 312 nm; (b) the
spectra theoretically simulated (scaled) at the dFt(B3LYP)/6-31++g(d, p) level for AH1 ( blue),
AH2 ( green), IO1 ( black solid line), IO2 ( red) and AO ( black dashed line) isomers of cytosine.
(Reproduced from [70], with permission from the PCCP owner Societies)
R. Fausto and N. Kuş
1680
1670
1195
1185
0.00
0.02
750
740
1760
1740
0.00
0.02
0.04
AH2 + AO
AO
IO2
IO2
IO2
IO2
IO1
IO1
IO1
IO1
IO1
IO1
AO
IO2
Absorbance
Wavenumber / cm
-1
Fig. 7.20 Fragments of the infrared spectrum of cytosine monomers isolated in an Ar matrix:
( black) recorded after deposition of the matrix; ( red) recorded after irradiation of the matrix with
uv (λ = 312 nm) monochromatic laser light, showing the syn↔anti isomerization within the
imino-oxo forms of cytosine. (Reproduced from [70], with permission from the PCCP owner
Societies)
1500
1400
1300
1200
1100
-200
-100
0
100
200
-0.04
-0.02
0.00
0.02
0.04
AH2
AH1
AH1
AH2
AH1, AH2
AH1
IO2
IO2
IO2
IO2
IO1
IO1
IO1
AO
AO
AO
AO
AO
Relative Intensity
Wavenumber / cm
-1
AO
IO1
AH1
b
Absorbance
a
Fig. 7.21 Phototransformation of the Ao tautomer of matrix-isolated cytosine into the AH1, AH2,
IO1 and IO2 forms. (a) subtraction result: the experimental spectrum recorded after uv irradiation at 311 nm minus the spectrum recorded after the previous uv irradiation at 312 nm; (b) the
spectra theoretically simulated (scaled) at the dFt(B3LYP)/6-31++g(d, p) level for AH1 ( blue),
AH2 ( green), IO1 ( black solid line), IO2 ( red) and AO ( black dashed line) isomers of cytosine.
(Reproduced from [70], with permission from the PCCP owner Societies)