

196
R. Fausto and N. Kuş
1450
1400
0.0
0.1
0.2
0.3
0.4
1450
1400
0.0
0.1
0.2
0.3
0.4
1450
1400
0.0
0.1
0.2
0.3
0.4
1450
1400
0.0
0.1
0.2
0.3
0.4
0 20 40 60 80 100 120
0
20
40
60
80
100
1450
1400
0.0
0.1
0.2
0.3
0.4
1450
1400
0.0
0.1
0.2
0.3
0.4
0 20 40 60 80 100 120
0
20
40
60
80
100
0 20 40 60 80 100 120
0
20
40
60
80
100
abundance, %
i
AH1
AH2
AH1
g
AH2
AH1
h
AH2
absorbance
a
b
AH1
AH1
abundance, %
c
AH1
absorbance
wavenumber / cm
-1
d
e
AH2
AH2
AH2
time / min
abundance, %
absorbance
f
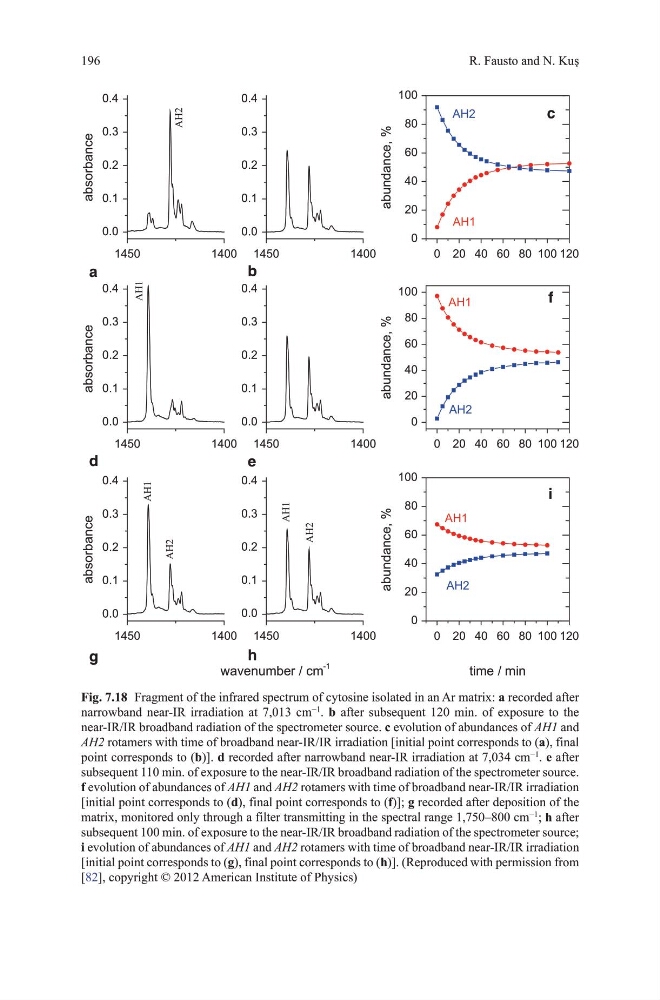
Fig. 7.18 Fragment of the infrared spectrum of cytosine isolated in an Ar matrix: a recorded after
narrowband near-IR irradiation at 7,013 cm
−1
. b after subsequent 120 min. of exposure to the
near-IR/IR broadband radiation of the spectrometer source. c evolution of abundances of AH1 and
AH2 rotamers with time of broadband near-IR/IR irradiation [initial point corresponds to (a), final
point corresponds to (b)]. d recorded after narrowband near-IR irradiation at 7,034 cm
−1
. e after
subsequent 110 min. of exposure to the near-IR/IR broadband radiation of the spectrometer source.
f evolution of abundances of AH1 and AH2 rotamers with time of broadband near-IR/IR irradiation
[initial point corresponds to (d), final point corresponds to (f)]; g recorded after deposition of the
matrix, monitored only through a filter transmitting in the spectral range 1,750–800 cm
−1
; h after
subsequent 100 min. of exposure to the near-IR/IR broadband radiation of the spectrometer source;
i evolution of abundances of AH1 and AH2 rotamers with time of broadband near-IR/IR irradiation
[initial point corresponds to (g), final point corresponds to (h)]. (Reproduced with permission from
[82], copyright © 2012 American Institute of Physics)
R. Fausto and N. Kuş
1450
1400
0.0
0.1
0.2
0.3
0.4
1450
1400
0.0
0.1
0.2
0.3
0.4
1450
1400
0.0
0.1
0.2
0.3
0.4
1450
1400
0.0
0.1
0.2
0.3
0.4
0 20 40 60 80 100 120
0
20
40
60
80
100
1450
1400
0.0
0.1
0.2
0.3
0.4
1450
1400
0.0
0.1
0.2
0.3
0.4
0 20 40 60 80 100 120
0
20
40
60
80
100
0 20 40 60 80 100 120
0
20
40
60
80
100
abundance, %
i
AH1
AH2
AH1
g
AH2
AH1
h
AH2
absorbance
a
b
AH1
AH1
abundance, %
c
AH1
absorbance
wavenumber / cm
-1
d
e
AH2
AH2
AH2
time / min
abundance, %
absorbance
f
Fig. 7.18 Fragment of the infrared spectrum of cytosine isolated in an Ar matrix: a recorded after
narrowband near-IR irradiation at 7,013 cm
−1
. b after subsequent 120 min. of exposure to the
near-IR/IR broadband radiation of the spectrometer source. c evolution of abundances of AH1 and
AH2 rotamers with time of broadband near-IR/IR irradiation [initial point corresponds to (a), final
point corresponds to (b)]. d recorded after narrowband near-IR irradiation at 7,034 cm
−1
. e after
subsequent 110 min. of exposure to the near-IR/IR broadband radiation of the spectrometer source.
f evolution of abundances of AH1 and AH2 rotamers with time of broadband near-IR/IR irradiation
[initial point corresponds to (d), final point corresponds to (f)]; g recorded after deposition of the
matrix, monitored only through a filter transmitting in the spectral range 1,750–800 cm
−1
; h after
subsequent 100 min. of exposure to the near-IR/IR broadband radiation of the spectrometer source;
i evolution of abundances of AH1 and AH2 rotamers with time of broadband near-IR/IR irradiation
[initial point corresponds to (g), final point corresponds to (h)]. (Reproduced with permission from
[82], copyright © 2012 American Institute of Physics)