

186
R. Fausto and N. Kuş
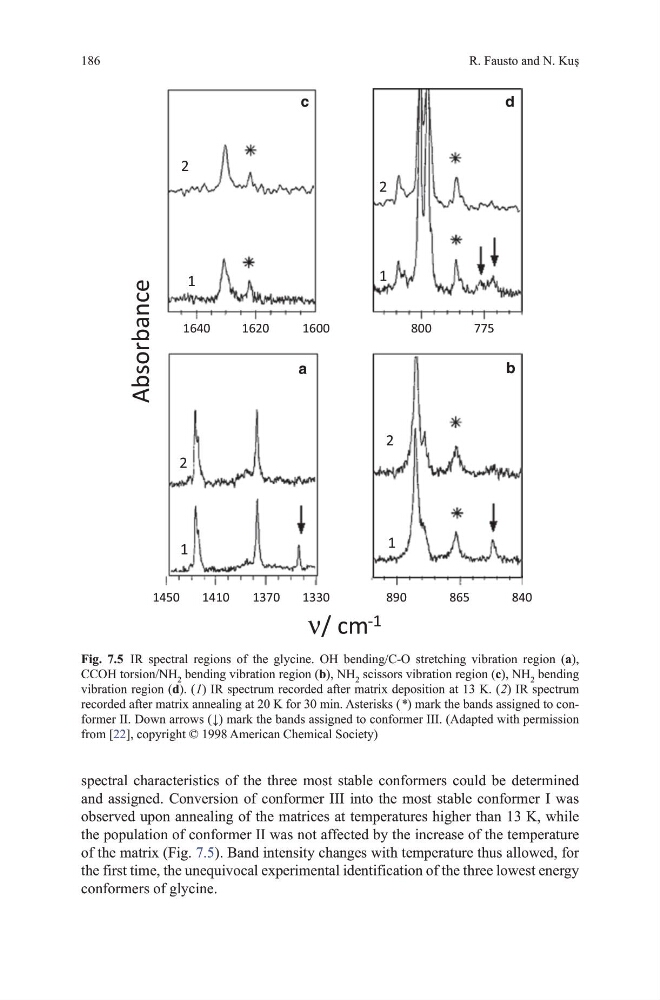
spectral characteristics of the three most stable conformers could be determined
and assigned. Conversion of conformer III into the most stable conformer I was
observed upon annealing of the matrices at temperatures higher than 13 K, while
the population of conformer II was not affected by the increase of the temperature
of the matrix (Fig. 7.5). Band intensity changes with temperature thus allowed, for
the first time, the unequivocal experimental identification of the three lowest energy
conformers of glycine.
Absorbance
1450
1410
1370
1330
890
8 65
840
ν/ cm -1
a
b
c
d
1
1
1
1
2
2
2
2
1640
1620
1600
800
775
Fig. 7.5 IR spectral regions of the glycine. oh bending/C-o stretching vibration region (a),
CCoh torsion/Nh 2 bending vibration region (b), Nh 2 scissors vibration region (c), Nh 2 bending
vibration region (d). ( 1) IR spectrum recorded after matrix deposition at 13 K. ( 2) IR spectrum
recorded after matrix annealing at 20 K for 30 min. Asterisks ( *) mark the bands assigned to conformer II. down arrows ( ↓) mark the bands assigned to conformer III. (Adapted with permission
from [22], copyright © 1998 American Chemical Society)
R. Fausto and N. Kuş
spectral characteristics of the three most stable conformers could be determined
and assigned. Conversion of conformer III into the most stable conformer I was
observed upon annealing of the matrices at temperatures higher than 13 K, while
the population of conformer II was not affected by the increase of the temperature
of the matrix (Fig. 7.5). Band intensity changes with temperature thus allowed, for
the first time, the unequivocal experimental identification of the three lowest energy
conformers of glycine.
Absorbance
1450
1410
1370
1330
890
8 65
840
ν/ cm -1
a
b
c
d
1
1
1
1
2
2
2
2
1640
1620
1600
800
775
Fig. 7.5 IR spectral regions of the glycine. oh bending/C-o stretching vibration region (a),
CCoh torsion/Nh 2 bending vibration region (b), Nh 2 scissors vibration region (c), Nh 2 bending
vibration region (d). ( 1) IR spectrum recorded after matrix deposition at 13 K. ( 2) IR spectrum
recorded after matrix annealing at 20 K for 30 min. Asterisks ( *) mark the bands assigned to conformer II. down arrows ( ↓) mark the bands assigned to conformer III. (Adapted with permission
from [22], copyright © 1998 American Chemical Society)