

165
neighboring group are likely [52]. most importantly, taking into consideration the
corresponding vacuum-uv Cd bands along with conventional far-uv Cd bands
results in a significant improvement of accuracy of Cd-based estimation of protein
secondary structure components [53]. It is also argued that expanding the far-uv
of protein Cd spectra with shorter wavelength range may enable distinguishing
between certain secondary structures such as parallel vs. antiparallel β-sheets, or
α- vs. 3 10 -helices which is otherwise impossible through the conventional Cd [53].
The most commonly studied far-UV CD spectral range is dominated by nπ*
and ππ* transitions within the peptide group, although these can be overlapped to
some extent by signals from aromatic side-chains in proteins with a high abundance
of tryptophan, tyrosine, and phenylalanine (e.g. Ref. 17). on the other hand, for
the low-intensity far-uv signal of polyproline II conformation the contamination
from the high-energy transitions in vacuum-uv may be significant [54]. Still, for
a typical protein, the corresponding far-uv Cd spectrum will reflect sum of contributions from different secondary components, and these could be approximated
through simplified spatial arrangements of main chain amide chromophores. Faruv Cd spectra of various types of secondary structure are shown in Fig. 6.2. the
characteristic spectral features of α-helix—the most common secondary motif in
proteins—consist of a couplet of strong positive and negative signals at 192 and
208 nm, respectively (both stemming from ππ* transitions), and another negative
and partly overlapping peak at 222 nm which originates from nπ* transitions. CD
intensity of a helical stretch of a polypeptide chain is approximately proportional to
its length (i.e. the average ellipticity of a helix per amino acid residue is constant).
however, with decreasing length of a helix, a deviation from this rule caused by
frayed unstructured ends of the helix becomes apparent. Simple empirical equations
have proven adequate to correct for this effect [7].
In contrast to the sharply defined geometrical constrains of an α-helix, β-sheets
are much more diverse equally in terms of arrangement of strands (parallel vs. antiparallel), their local twist, and a strength of interstrand hydrogen bonds. the adaptability of the β- conformation to changes in local geometry is reflected by the large
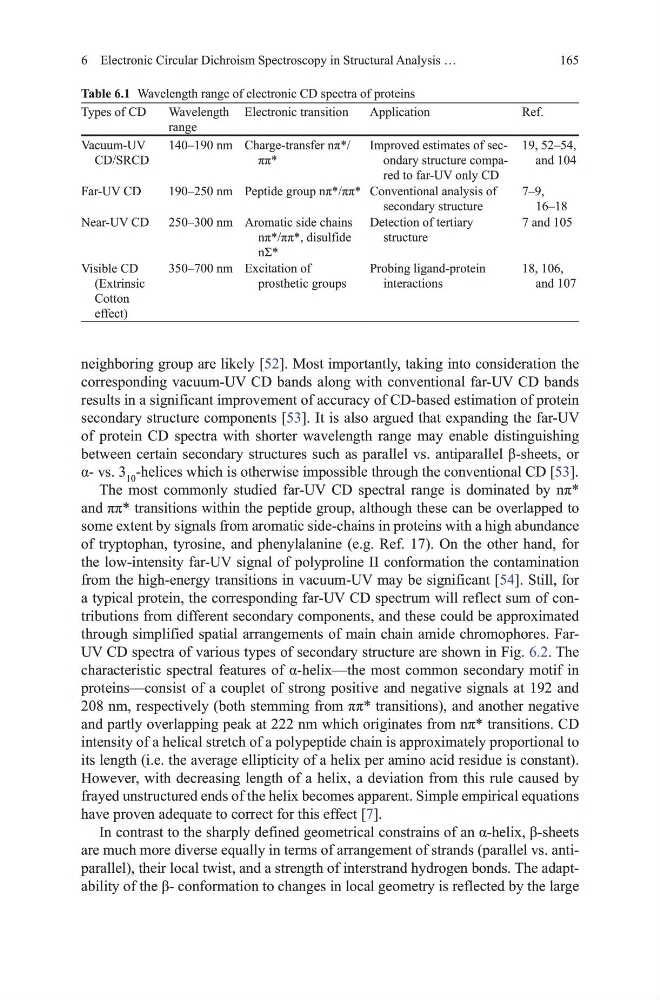
Table 6.1 Wavelength range of electronic Cd spectra of proteins
types of Cd
Wavelength
range
Electronic transition
Application
Ref.
vacuum-uv
Cd/SRCd
140–190 nm Charge-transfer nπ*/
ππ*
Improved estimates of secondary structure compared to far-uv only Cd
19, 52–54,
and 104
Far-uv Cd
190–250 nm Peptide group nπ*/ππ* Conventional analysis of
secondary structure
7–9,
16–18
Near-uv Cd
250–300 nm Aromatic side chains
nπ*/ππ*, disulfide
nΣ*
detection of tertiary
structure
7 and 105
visible Cd
(Extrinsic
Cotton
effect)
350–700 nm Excitation of
prosthetic groups
Probing ligand-protein
interactions
18, 106,
and 107
6 Electronic Circular dichroism Spectroscopy in Structural Analysis …
neighboring group are likely [52]. most importantly, taking into consideration the
corresponding vacuum-uv Cd bands along with conventional far-uv Cd bands
results in a significant improvement of accuracy of Cd-based estimation of protein
secondary structure components [53]. It is also argued that expanding the far-uv
of protein Cd spectra with shorter wavelength range may enable distinguishing
between certain secondary structures such as parallel vs. antiparallel β-sheets, or
α- vs. 3 10 -helices which is otherwise impossible through the conventional Cd [53].
The most commonly studied far-UV CD spectral range is dominated by nπ*
and ππ* transitions within the peptide group, although these can be overlapped to
some extent by signals from aromatic side-chains in proteins with a high abundance
of tryptophan, tyrosine, and phenylalanine (e.g. Ref. 17). on the other hand, for
the low-intensity far-uv signal of polyproline II conformation the contamination
from the high-energy transitions in vacuum-uv may be significant [54]. Still, for
a typical protein, the corresponding far-uv Cd spectrum will reflect sum of contributions from different secondary components, and these could be approximated
through simplified spatial arrangements of main chain amide chromophores. Faruv Cd spectra of various types of secondary structure are shown in Fig. 6.2. the
characteristic spectral features of α-helix—the most common secondary motif in
proteins—consist of a couplet of strong positive and negative signals at 192 and
208 nm, respectively (both stemming from ππ* transitions), and another negative
and partly overlapping peak at 222 nm which originates from nπ* transitions. CD
intensity of a helical stretch of a polypeptide chain is approximately proportional to
its length (i.e. the average ellipticity of a helix per amino acid residue is constant).
however, with decreasing length of a helix, a deviation from this rule caused by
frayed unstructured ends of the helix becomes apparent. Simple empirical equations
have proven adequate to correct for this effect [7].
In contrast to the sharply defined geometrical constrains of an α-helix, β-sheets
are much more diverse equally in terms of arrangement of strands (parallel vs. antiparallel), their local twist, and a strength of interstrand hydrogen bonds. the adaptability of the β- conformation to changes in local geometry is reflected by the large
Table 6.1 Wavelength range of electronic Cd spectra of proteins
types of Cd
Wavelength
range
Electronic transition
Application
Ref.
vacuum-uv
Cd/SRCd
140–190 nm Charge-transfer nπ*/
ππ*
Improved estimates of secondary structure compared to far-uv only Cd
19, 52–54,
and 104
Far-uv Cd
190–250 nm Peptide group nπ*/ππ* Conventional analysis of
secondary structure
7–9,
16–18
Near-uv Cd
250–300 nm Aromatic side chains
nπ*/ππ*, disulfide
nΣ*
detection of tertiary
structure
7 and 105
visible Cd
(Extrinsic
Cotton
effect)
350–700 nm Excitation of
prosthetic groups
Probing ligand-protein
interactions
18, 106,
and 107
6 Electronic Circular dichroism Spectroscopy in Structural Analysis …