

5 α-Amino Acids In Water: A Review of VCD and ROA Spectra
117
averaging of the bands of individual rotamers. the bands exhibited different sensitivities to group rotations and usually became broader for Raman and weaker for RoA.
very importantly, the RoA signs of about half of the total number of the bands were
reversed by the three studied rotations. the disagreement between simulated spectra
with the experimental ones in the C-h and N-h bending region (1500–1415 cm
−1
)
was thought to be an effect of anharmonic interactions perturbing these very motions.
In the next study by Daněček et al., [199] the role of anharmonic terms in the potential
and intensity tensors was systematically explored by vibrational self-consistent field,
vibrational configuration interaction (vCI), and degeneracy-corrected perturbation
calculations. the harmonic frequencies obtained using 23 dFt functionals and the
hF and mP2 methods, the 6-31 + + g** basis set, and the CPCm model of bulk water
were compared to experimental band positions. the harmonic approach appeared
satisfactory for vibrations in the 1800–200 cm
−1
region. the anharmonic corrections
included by numerical differentiation did not lead to complete agreement between the
experimental and calculated RoA spectra. however, for the C–h stretching and N–h
and C–h bending modes, a significant improvement in the Raman and RoA spectral
profiles was achieved with use of the vCI correction. A limited Boltzmann averaging
for the lowest-frequency modes that could not be included directly in the anharmonic
calculus provided realistic inhomogeneous band broadening. the anharmonic parts
of the intensity tensors (second dipole and polarisability derivatives) were found to be
less important for the entire spectral profile than the force field anharmonicities (third
and fourth energy derivatives), except for a few weak combination bands which were
dominated by the anharmonic tensor contributions. It was concluded that the assignment of the experimental spectra for the 1550–1205 cm
−1
range were still not reliable, but this time the authors explained this fact by the high density of C–h bending
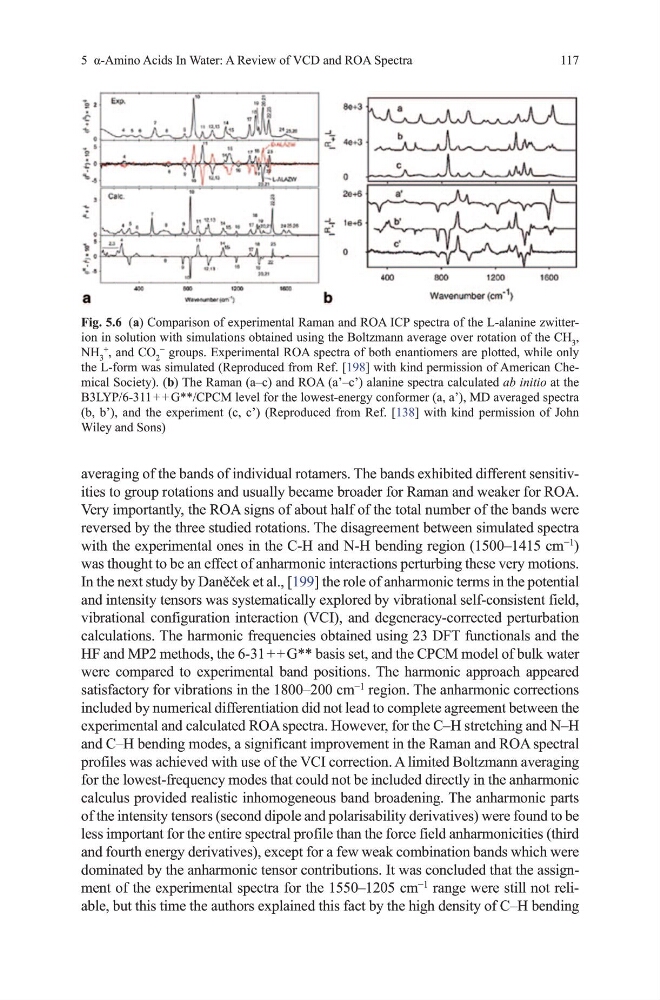
Fig. 5.6 (a) Comparison of experimental Raman and RoA ICP spectra of the L-alanine zwitterion in solution with simulations obtained using the Boltzmann average over rotation of the Ch 3 ,
Nh 3
+
, and Co 2
−
groups. Experimental RoA spectra of both enantiomers are plotted, while only
the L-form was simulated (Reproduced from Ref. [198] with kind permission of American Chemical Society). (b) the Raman (a–c) and RoA (a’–c’) alanine spectra calculated ab initio at the
B3LYP/6-311 + + g**/CPCm level for the lowest-energy conformer (a, a’), md averaged spectra
(b, b’), and the experiment (c, c’) (Reproduced from Ref. [138] with kind permission of John
Wiley and Sons)
117
averaging of the bands of individual rotamers. the bands exhibited different sensitivities to group rotations and usually became broader for Raman and weaker for RoA.
very importantly, the RoA signs of about half of the total number of the bands were
reversed by the three studied rotations. the disagreement between simulated spectra
with the experimental ones in the C-h and N-h bending region (1500–1415 cm
−1
)
was thought to be an effect of anharmonic interactions perturbing these very motions.
In the next study by Daněček et al., [199] the role of anharmonic terms in the potential
and intensity tensors was systematically explored by vibrational self-consistent field,
vibrational configuration interaction (vCI), and degeneracy-corrected perturbation
calculations. the harmonic frequencies obtained using 23 dFt functionals and the
hF and mP2 methods, the 6-31 + + g** basis set, and the CPCm model of bulk water
were compared to experimental band positions. the harmonic approach appeared
satisfactory for vibrations in the 1800–200 cm
−1
region. the anharmonic corrections
included by numerical differentiation did not lead to complete agreement between the
experimental and calculated RoA spectra. however, for the C–h stretching and N–h
and C–h bending modes, a significant improvement in the Raman and RoA spectral
profiles was achieved with use of the vCI correction. A limited Boltzmann averaging
for the lowest-frequency modes that could not be included directly in the anharmonic
calculus provided realistic inhomogeneous band broadening. the anharmonic parts
of the intensity tensors (second dipole and polarisability derivatives) were found to be
less important for the entire spectral profile than the force field anharmonicities (third
and fourth energy derivatives), except for a few weak combination bands which were
dominated by the anharmonic tensor contributions. It was concluded that the assignment of the experimental spectra for the 1550–1205 cm
−1
range were still not reliable, but this time the authors explained this fact by the high density of C–h bending
Fig. 5.6 (a) Comparison of experimental Raman and RoA ICP spectra of the L-alanine zwitterion in solution with simulations obtained using the Boltzmann average over rotation of the Ch 3 ,
Nh 3
+
, and Co 2
−
groups. Experimental RoA spectra of both enantiomers are plotted, while only
the L-form was simulated (Reproduced from Ref. [198] with kind permission of American Chemical Society). (b) the Raman (a–c) and RoA (a’–c’) alanine spectra calculated ab initio at the
B3LYP/6-311 + + g**/CPCm level for the lowest-energy conformer (a, a’), md averaged spectra
(b, b’), and the experiment (c, c’) (Reproduced from Ref. [138] with kind permission of John
Wiley and Sons)