

J. C. Dobrowolsk et al.
112
the pd: 4266 < 4435 < 4381 < 4312 cm
−1
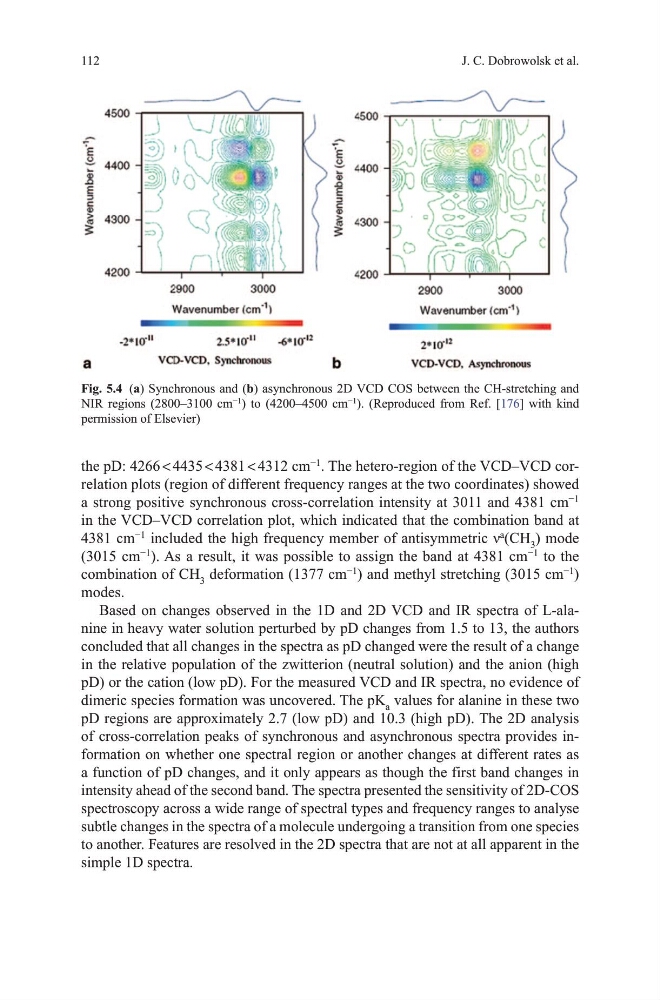
. the hetero-region of the vCd–vCd correlation plots (region of different frequency ranges at the two coordinates) showed
a strong positive synchronous cross-correlation intensity at 3011 and 4381 cm
−1
in the vCd–vCd correlation plot, which indicated that the combination band at
4381 cm
−1
included the high frequency member of antisymmetric ν
a
(Ch 3 ) mode
(3015 cm
−1
). As a result, it was possible to assign the band at 4381 cm
−1
to the
combination of Ch 3 deformation (1377 cm
−1
) and methyl stretching (3015 cm
−1
)
modes.
Based on changes observed in the 1d and 2d vCd and IR spectra of L-alanine in heavy water solution perturbed by pd changes from 1.5 to 13, the authors
concluded that all changes in the spectra as pd changed were the result of a change
in the relative population of the zwitterion (neutral solution) and the anion (high
pd) or the cation (low pd). For the measured vCd and IR spectra, no evidence of
dimeric species formation was uncovered. the pK a values for alanine in these two
pd regions are approximately 2.7 (low pd) and 10.3 (high pd). the 2d analysis
of cross-correlation peaks of synchronous and asynchronous spectra provides information on whether one spectral region or another changes at different rates as
a function of pd changes, and it only appears as though the first band changes in
intensity ahead of the second band. the spectra presented the sensitivity of 2d-CoS
spectroscopy across a wide range of spectral types and frequency ranges to analyse
subtle changes in the spectra of a molecule undergoing a transition from one species
to another. Features are resolved in the 2d spectra that are not at all apparent in the
simple 1d spectra.
Fig. 5.4 (a) Synchronous and (b) asynchronous 2d vCd CoS between the Ch-stretching and
NIR regions (2800–3100 cm
−1
) to (4200–4500 cm
−1
). (Reproduced from Ref. [176] with kind
permission of Elsevier)
112
the pd: 4266 < 4435 < 4381 < 4312 cm
−1
. the hetero-region of the vCd–vCd correlation plots (region of different frequency ranges at the two coordinates) showed
a strong positive synchronous cross-correlation intensity at 3011 and 4381 cm
−1
in the vCd–vCd correlation plot, which indicated that the combination band at
4381 cm
−1
included the high frequency member of antisymmetric ν
a
(Ch 3 ) mode
(3015 cm
−1
). As a result, it was possible to assign the band at 4381 cm
−1
to the
combination of Ch 3 deformation (1377 cm
−1
) and methyl stretching (3015 cm
−1
)
modes.
Based on changes observed in the 1d and 2d vCd and IR spectra of L-alanine in heavy water solution perturbed by pd changes from 1.5 to 13, the authors
concluded that all changes in the spectra as pd changed were the result of a change
in the relative population of the zwitterion (neutral solution) and the anion (high
pd) or the cation (low pd). For the measured vCd and IR spectra, no evidence of
dimeric species formation was uncovered. the pK a values for alanine in these two
pd regions are approximately 2.7 (low pd) and 10.3 (high pd). the 2d analysis
of cross-correlation peaks of synchronous and asynchronous spectra provides information on whether one spectral region or another changes at different rates as
a function of pd changes, and it only appears as though the first band changes in
intensity ahead of the second band. the spectra presented the sensitivity of 2d-CoS
spectroscopy across a wide range of spectral types and frequency ranges to analyse
subtle changes in the spectra of a molecule undergoing a transition from one species
to another. Features are resolved in the 2d spectra that are not at all apparent in the
simple 1d spectra.
Fig. 5.4 (a) Synchronous and (b) asynchronous 2d vCd CoS between the Ch-stretching and
NIR regions (2800–3100 cm
−1
) to (4200–4500 cm
−1
). (Reproduced from Ref. [176] with kind
permission of Elsevier)