

5 α-Amino Acids In Water: A Review of VCD and ROA Spectra
111
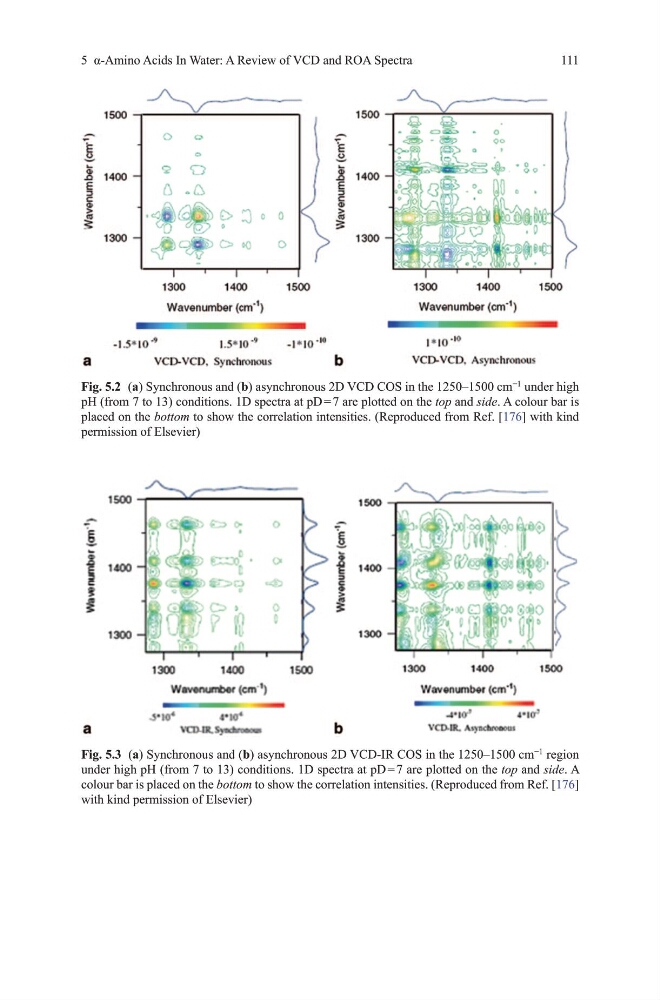
Fig. 5.2 (a) Synchronous and (b) asynchronous 2d vCd CoS in the 1250–1500 cm
−1
under high
ph (from 7 to 13) conditions. 1d spectra at pd = 7 are plotted on the top and side. A colour bar is
placed on the bottom to show the correlation intensities. (Reproduced from Ref. [176] with kind
permission of Elsevier)
Fig. 5.3 (a) Synchronous and (b) asynchronous 2d vCd-IR CoS in the 1250–1500 cm
−1
region
under high ph (from 7 to 13) conditions. 1d spectra at pd = 7 are plotted on the top and side. A
colour bar is placed on the bottom to show the correlation intensities. (Reproduced from Ref. [176]
with kind permission of Elsevier)
111
Fig. 5.2 (a) Synchronous and (b) asynchronous 2d vCd CoS in the 1250–1500 cm
−1
under high
ph (from 7 to 13) conditions. 1d spectra at pd = 7 are plotted on the top and side. A colour bar is
placed on the bottom to show the correlation intensities. (Reproduced from Ref. [176] with kind
permission of Elsevier)
Fig. 5.3 (a) Synchronous and (b) asynchronous 2d vCd-IR CoS in the 1250–1500 cm
−1
region
under high ph (from 7 to 13) conditions. 1d spectra at pd = 7 are plotted on the top and side. A
colour bar is placed on the bottom to show the correlation intensities. (Reproduced from Ref. [176]
with kind permission of Elsevier)