

the first photon, the final two-photon cross-section would be close to zero. In fact,
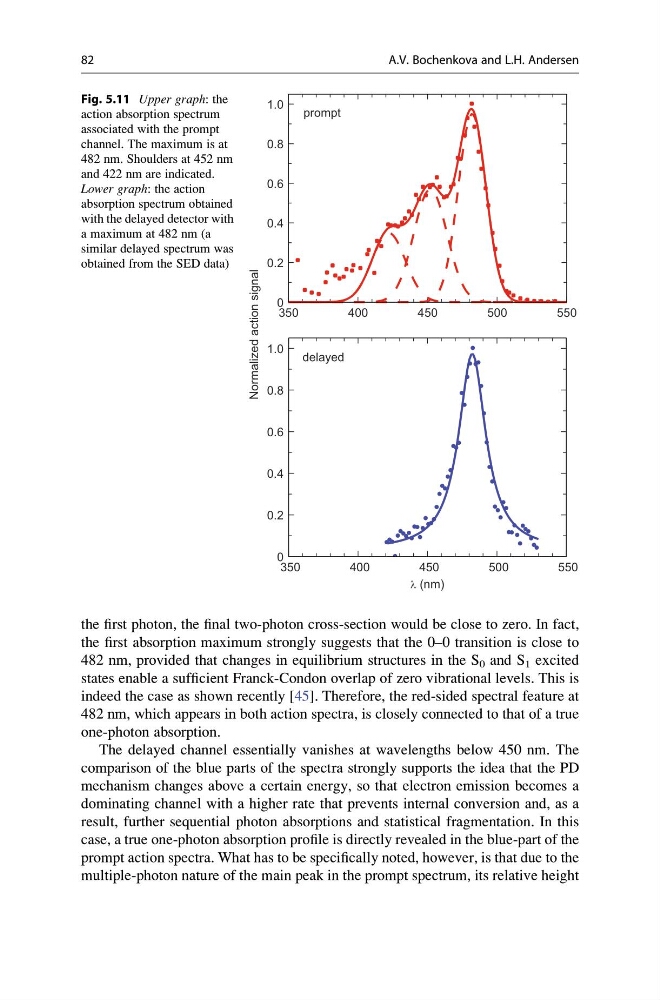
the first absorption maximum strongly suggests that the 0–0 transition is close to
482 nm, provided that changes in equilibrium structures in the S 0 and S 1 excited
states enable a sufficient Franck-Condon overlap of zero vibrational levels. This is
indeed the case as shown recently [45]. Therefore, the red-sided spectral feature at
482 nm, which appears in both action spectra, is closely connected to that of a true
one-photon absorption.
The delayed channel essentially vanishes at wavelengths below 450 nm. The
comparison of the blue parts of the spectra strongly supports the idea that the PD
mechanism changes above a certain energy, so that electron emission becomes a
dominating channel with a higher rate that prevents internal conversion and, as a
result, further sequential photon absorptions and statistical fragmentation. In this
case, a true one-photon absorption profile is directly revealed in the blue-part of the
prompt action spectra. What has to be specifically noted, however, is that due to the
multiple-photon nature of the main peak in the prompt spectrum, its relative height
Normalized action signal
(nm)
0
0.2
0.4
0.6
0.8
1.0
350
400
450
500
550
delayed
0
0.2
0.4
0.6
0.8
1.0
350
400
450
500
550
prompt
Fig. 5.11 Upper graph: the
action absorption spectrum
associated with the prompt
channel. The maximum is at
482 nm. Shoulders at 452 nm
and 422 nm are indicated.
Lower graph: the action
absorption spectrum obtained
with the delayed detector with
a maximum at 482 nm (a
similar delayed spectrum was
obtained from the SED data)
82
A.V. Bochenkova and L.H. Andersen
the first absorption maximum strongly suggests that the 0–0 transition is close to
482 nm, provided that changes in equilibrium structures in the S 0 and S 1 excited
states enable a sufficient Franck-Condon overlap of zero vibrational levels. This is
indeed the case as shown recently [45]. Therefore, the red-sided spectral feature at
482 nm, which appears in both action spectra, is closely connected to that of a true
one-photon absorption.
The delayed channel essentially vanishes at wavelengths below 450 nm. The
comparison of the blue parts of the spectra strongly supports the idea that the PD
mechanism changes above a certain energy, so that electron emission becomes a
dominating channel with a higher rate that prevents internal conversion and, as a
result, further sequential photon absorptions and statistical fragmentation. In this
case, a true one-photon absorption profile is directly revealed in the blue-part of the
prompt action spectra. What has to be specifically noted, however, is that due to the
multiple-photon nature of the main peak in the prompt spectrum, its relative height
Normalized action signal
(nm)
0
0.2
0.4
0.6
0.8
1.0
350
400
450
500
550
delayed
0
0.2
0.4
0.6
0.8
1.0
350
400
450
500
550
prompt
Fig. 5.11 Upper graph: the
action absorption spectrum
associated with the prompt
channel. The maximum is at
482 nm. Shoulders at 452 nm
and 422 nm are indicated.
Lower graph: the action
absorption spectrum obtained
with the delayed detector with
a maximum at 482 nm (a
similar delayed spectrum was
obtained from the SED data)
82
A.V. Bochenkova and L.H. Andersen