

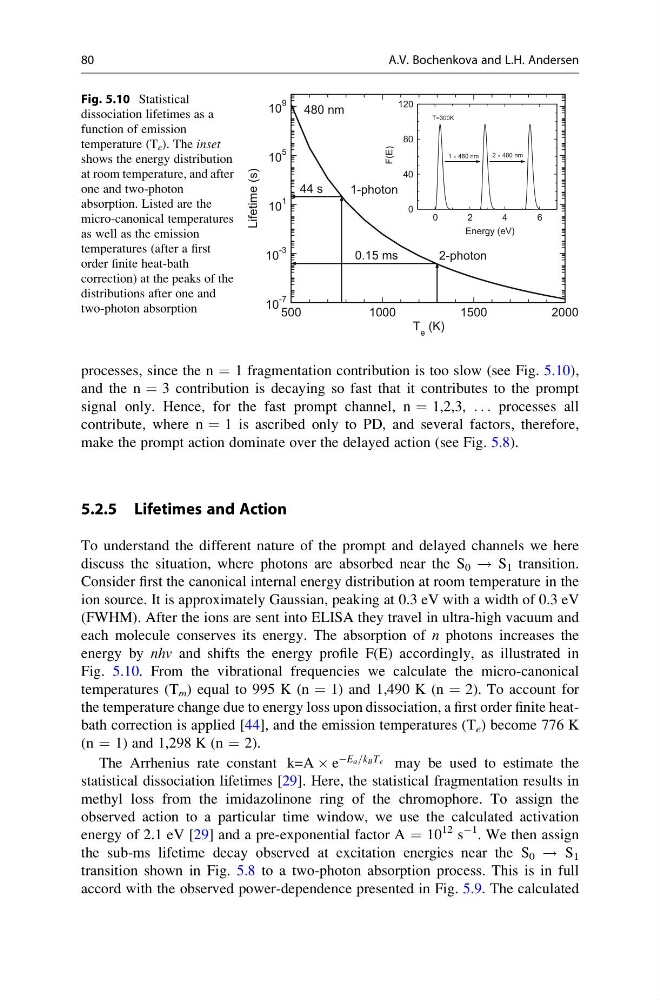
processes, since the n ¼ 1 fragmentation contribution is too slow (see Fig. 5.10),
and the n ¼ 3 contribution is decaying so fast that it contributes to the prompt
signal only. Hence, for the fast prompt channel, n ¼ 1,2,3, . . . processes all
contribute, where n ¼ 1 is ascribed only to PD, and several factors, therefore,
make the prompt action dominate over the delayed action (see Fig. 5.8).
5.2.5 Lifetimes and Action
To understand the different nature of the prompt and delayed channels we here
discuss the situation, where photons are absorbed near the S 0 ! S 1 transition.
Consider first the canonical internal energy distribution at room temperature in the
ion source. It is approximately Gaussian, peaking at 0.3 eV with a width of 0.3 eV
(FWHM). After the ions are sent into ELISA they travel in ultra-high vacuum and
each molecule conserves its energy. The absorption of n photons increases the
energy by nhv and shifts the energy profile F(E) accordingly, as illustrated in
Fig. 5.10. From the vibrational frequencies we calculate the micro-canonical
temperatures (T m ) equal to 995 K (n ¼ 1) and 1,490 K (n ¼ 2). To account for
the temperature change due to energy loss upon dissociation, a first order finite heatbath correction is applied [44], and the emission temperatures (T e ) become 776 K
(n ¼ 1) and 1,298 K (n ¼ 2).
The Arrhenius rate constant k=A Â e
ÀE a =k B T e may be used to estimate the
statistical dissociation lifetimes [29]. Here, the statistical fragmentation results in
methyl loss from the imidazolinone ring of the chromophore. To assign the
observed action to a particular time window, we use the calculated activation
energy of 2.1 eV [29] and a pre-exponential factor A ¼ 10
12 s
À1 . We then assign
the sub-ms lifetime decay observed at excitation energies near the S 0 ! S 1
transition shown in Fig. 5.8 to a two-photon absorption process. This is in full
accord with the observed power-dependence presented in Fig. 5.9. The calculated
10
-7
10
-3
10
1
10
5
10
9
500
1000
1500
2000
2-photon
1-photon
44 s
0.15 ms
480 nm
T e (K)
Lifetime (s)
0
40
80
120
0
2
4
6
2 480 nm
1 480 nm
T=300K
Energy (eV)
F(E)
Fig. 5.10 Statistical
dissociation lifetimes as a
function of emission
temperature (T e ). The inset
shows the energy distribution
at room temperature, and after
one and two-photon
absorption. Listed are the
micro-canonical temperatures
as well as the emission
temperatures (after a first
order finite heat-bath
correction) at the peaks of the
distributions after one and
two-photon absorption
80
A.V. Bochenkova and L.H. Andersen
and the n ¼ 3 contribution is decaying so fast that it contributes to the prompt
signal only. Hence, for the fast prompt channel, n ¼ 1,2,3, . . . processes all
contribute, where n ¼ 1 is ascribed only to PD, and several factors, therefore,
make the prompt action dominate over the delayed action (see Fig. 5.8).
5.2.5 Lifetimes and Action
To understand the different nature of the prompt and delayed channels we here
discuss the situation, where photons are absorbed near the S 0 ! S 1 transition.
Consider first the canonical internal energy distribution at room temperature in the
ion source. It is approximately Gaussian, peaking at 0.3 eV with a width of 0.3 eV
(FWHM). After the ions are sent into ELISA they travel in ultra-high vacuum and
each molecule conserves its energy. The absorption of n photons increases the
energy by nhv and shifts the energy profile F(E) accordingly, as illustrated in
Fig. 5.10. From the vibrational frequencies we calculate the micro-canonical
temperatures (T m ) equal to 995 K (n ¼ 1) and 1,490 K (n ¼ 2). To account for
the temperature change due to energy loss upon dissociation, a first order finite heatbath correction is applied [44], and the emission temperatures (T e ) become 776 K
(n ¼ 1) and 1,298 K (n ¼ 2).
The Arrhenius rate constant k=A Â e
ÀE a =k B T e may be used to estimate the
statistical dissociation lifetimes [29]. Here, the statistical fragmentation results in
methyl loss from the imidazolinone ring of the chromophore. To assign the
observed action to a particular time window, we use the calculated activation
energy of 2.1 eV [29] and a pre-exponential factor A ¼ 10
12 s
À1 . We then assign
the sub-ms lifetime decay observed at excitation energies near the S 0 ! S 1
transition shown in Fig. 5.8 to a two-photon absorption process. This is in full
accord with the observed power-dependence presented in Fig. 5.9. The calculated
10
-7
10
-3
10
1
10
5
10
9
500
1000
1500
2000
2-photon
1-photon
44 s
0.15 ms
480 nm
T e (K)
Lifetime (s)
0
40
80
120
0
2
4
6
2 480 nm
1 480 nm
T=300K
Energy (eV)
F(E)
Fig. 5.10 Statistical
dissociation lifetimes as a
function of emission
temperature (T e ). The inset
shows the energy distribution
at room temperature, and after
one and two-photon
absorption. Listed are the
micro-canonical temperatures
as well as the emission
temperatures (after a first
order finite heat-bath
correction) at the peaks of the
distributions after one and
two-photon absorption
80
A.V. Bochenkova and L.H. Andersen