

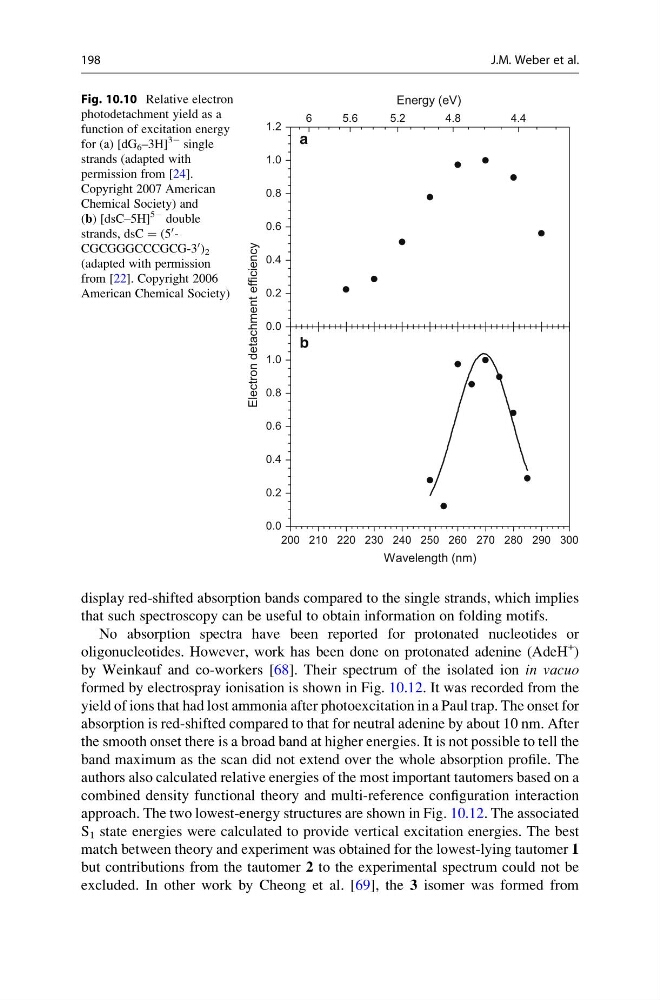
display red-shifted absorption bands compared to the single strands, which implies
that such spectroscopy can be useful to obtain information on folding motifs.
No absorption spectra have been reported for protonated nucleotides or
oligonucleotides. However, work has been done on protonated adenine (AdeH
+
)
by Weinkauf and co-workers [68]. Their spectrum of the isolated ion in vacuo
formed by electrospray ionisation is shown in Fig. 10.12. It was recorded from the
yield of ions that had lost ammonia after photoexcitation in a Paul trap. The onset for
absorption is red-shifted compared to that for neutral adenine by about 10 nm. After
the smooth onset there is a broad band at higher energies. It is not possible to tell the
band maximum as the scan did not extend over the whole absorption profile. The
authors also calculated relative energies of the most important tautomers based on a
combined density functional theory and multi-reference configuration interaction
approach. The two lowest-energy structures are shown in Fig. 10.12. The associated
S 1 state energies were calculated to provide vertical excitation energies. The best
match between theory and experiment was obtained for the lowest-lying tautomer 1
but contributions from the tautomer 2 to the experimental spectrum could not be
excluded. In other work by Cheong et al. [69], the 3 isomer was formed from
0.0
0.2
0.4
0.6
0.8
1.0
1.2
Energy (eV)
200 210 220 230 240 250 260 270 280 290 300
0.0
0.2
0.4
0.6
0.8
1.0
Electron detachment efficiency
Wavelength (nm)
6
5.6
5.2
4.8
4.4
a
b
Fig. 10.10 Relative electron
photodetachment yield as a
function of excitation energy
for (a) [dG 6 –3H]
3À single
strands (adapted with
permission from [24].
Copyright 2007 American
Chemical Society) and
(b) [dsC–5H]
5À double
strands, dsC ¼ (5
0 -
CGCGGGCCCGCG-3
0 ) 2
(adapted with permission
from [22]. Copyright 2006
American Chemical Society)
198
J.M. Weber et al.
that such spectroscopy can be useful to obtain information on folding motifs.
No absorption spectra have been reported for protonated nucleotides or
oligonucleotides. However, work has been done on protonated adenine (AdeH
+
)
by Weinkauf and co-workers [68]. Their spectrum of the isolated ion in vacuo
formed by electrospray ionisation is shown in Fig. 10.12. It was recorded from the
yield of ions that had lost ammonia after photoexcitation in a Paul trap. The onset for
absorption is red-shifted compared to that for neutral adenine by about 10 nm. After
the smooth onset there is a broad band at higher energies. It is not possible to tell the
band maximum as the scan did not extend over the whole absorption profile. The
authors also calculated relative energies of the most important tautomers based on a
combined density functional theory and multi-reference configuration interaction
approach. The two lowest-energy structures are shown in Fig. 10.12. The associated
S 1 state energies were calculated to provide vertical excitation energies. The best
match between theory and experiment was obtained for the lowest-lying tautomer 1
but contributions from the tautomer 2 to the experimental spectrum could not be
excluded. In other work by Cheong et al. [69], the 3 isomer was formed from
0.0
0.2
0.4
0.6
0.8
1.0
1.2
Energy (eV)
200 210 220 230 240 250 260 270 280 290 300
0.0
0.2
0.4
0.6
0.8
1.0
Electron detachment efficiency
Wavelength (nm)
6
5.6
5.2
4.8
4.4
a
b
Fig. 10.10 Relative electron
photodetachment yield as a
function of excitation energy
for (a) [dG 6 –3H]
3À single
strands (adapted with
permission from [24].
Copyright 2007 American
Chemical Society) and
(b) [dsC–5H]
5À double
strands, dsC ¼ (5
0 -
CGCGGGCCCGCG-3
0 ) 2
(adapted with permission
from [22]. Copyright 2006
American Chemical Society)
198
J.M. Weber et al.