

structural motifs of the strands in the ion beam are likely being sampled. For
example, in the case of dinucleotides, Gidden and Bowers [64] identified three
families of conformations from ion-mobility experiments, stacked, hydrogenbonded, and open conformations (see representative examples on Fig. 10.9). However, the propensity of stacking is expected to increase with the number of bases for
singly-charged strands. Nonetheless, even though theory and experiment seem to
agree that the base–base interactions result in slightly blue-shifted absorption
bands, more work is needed to better establish the details.
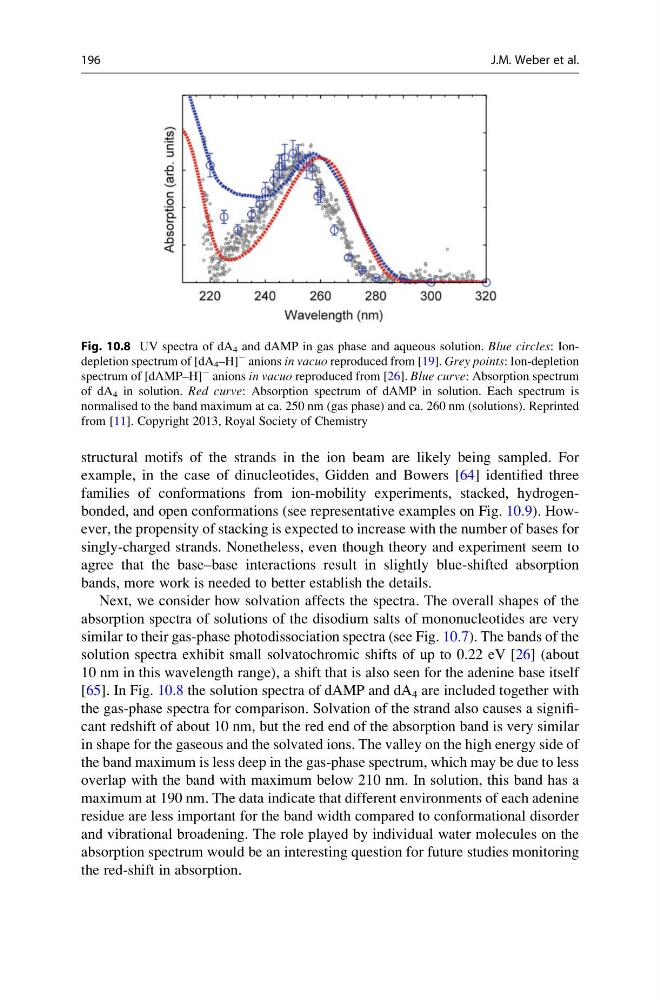
Next, we consider how solvation affects the spectra. The overall shapes of the
absorption spectra of solutions of the disodium salts of mononucleotides are very
similar to their gas-phase photodissociation spectra (see Fig. 10.7). The bands of the
solution spectra exhibit small solvatochromic shifts of up to 0.22 eV [26] (about
10 nm in this wavelength range), a shift that is also seen for the adenine base itself
[65]. In Fig. 10.8 the solution spectra of dAMP and dA 4 are included together with
the gas-phase spectra for comparison. Solvation of the strand also causes a significant redshift of about 10 nm, but the red end of the absorption band is very similar
in shape for the gaseous and the solvated ions. The valley on the high energy side of
the band maximum is less deep in the gas-phase spectrum, which may be due to less
overlap with the band with maximum below 210 nm. In solution, this band has a
maximum at 190 nm. The data indicate that different environments of each adenine
residue are less important for the band width compared to conformational disorder
and vibrational broadening. The role played by individual water molecules on the
absorption spectrum would be an interesting question for future studies monitoring
the red-shift in absorption.
Fig. 10.8 UV spectra of dA 4 and dAMP in gas phase and aqueous solution. Blue circles: Iondepletion spectrum of [dA 4 –H]
À anions in vacuo reproduced from [19]. Grey points: Ion-depletion
spectrum of [dAMP–H]
À anions in vacuo reproduced from [26]. Blue curve: Absorption spectrum
of dA 4 in solution. Red curve: Absorption spectrum of dAMP in solution. Each spectrum is
normalised to the band maximum at ca. 250 nm (gas phase) and ca. 260 nm (solutions). Reprinted
from [11]. Copyright 2013, Royal Society of Chemistry
196
J.M. Weber et al.
example, in the case of dinucleotides, Gidden and Bowers [64] identified three
families of conformations from ion-mobility experiments, stacked, hydrogenbonded, and open conformations (see representative examples on Fig. 10.9). However, the propensity of stacking is expected to increase with the number of bases for
singly-charged strands. Nonetheless, even though theory and experiment seem to
agree that the base–base interactions result in slightly blue-shifted absorption
bands, more work is needed to better establish the details.
Next, we consider how solvation affects the spectra. The overall shapes of the
absorption spectra of solutions of the disodium salts of mononucleotides are very
similar to their gas-phase photodissociation spectra (see Fig. 10.7). The bands of the
solution spectra exhibit small solvatochromic shifts of up to 0.22 eV [26] (about
10 nm in this wavelength range), a shift that is also seen for the adenine base itself
[65]. In Fig. 10.8 the solution spectra of dAMP and dA 4 are included together with
the gas-phase spectra for comparison. Solvation of the strand also causes a significant redshift of about 10 nm, but the red end of the absorption band is very similar
in shape for the gaseous and the solvated ions. The valley on the high energy side of
the band maximum is less deep in the gas-phase spectrum, which may be due to less
overlap with the band with maximum below 210 nm. In solution, this band has a
maximum at 190 nm. The data indicate that different environments of each adenine
residue are less important for the band width compared to conformational disorder
and vibrational broadening. The role played by individual water molecules on the
absorption spectrum would be an interesting question for future studies monitoring
the red-shift in absorption.
Fig. 10.8 UV spectra of dA 4 and dAMP in gas phase and aqueous solution. Blue circles: Iondepletion spectrum of [dA 4 –H]
À anions in vacuo reproduced from [19]. Grey points: Ion-depletion
spectrum of [dAMP–H]
À anions in vacuo reproduced from [26]. Blue curve: Absorption spectrum
of dA 4 in solution. Red curve: Absorption spectrum of dAMP in solution. Each spectrum is
normalised to the band maximum at ca. 250 nm (gas phase) and ca. 260 nm (solutions). Reprinted
from [11]. Copyright 2013, Royal Society of Chemistry
196
J.M. Weber et al.