

exciton states. A way to avoid the complication of different base
microenvironments is to do spectroscopy of isolated systems in vacuo.
The first gas-phase spectra of mononucleotides were published by Weber and
co-workers [26–28] (see Fig. 10.7). Strictly speaking, these spectra do not represent
the energy-dependent absorption cross section σ abs (E) as they were obtained measuring photodissociation. Therefore, they represent the absorption cross section
multiplied by the photodestruction probability p d (E) (in ion depletion spectra) or
multiplied by the fragmentation probability p f (E) for a specific fragment ion (in
fragment action spectra). These probabilities are not constant across the spectrum
and can lead to large variations of the fragment branching ratios for different
energies. We note that these photodissociation spectra are still often referred to as
absorption spectra in the literature. This terminology is only applicable in a very
limited number of cases, e.g., for ion depletion spectra if all absorption events lead
to the destruction of the parent ion with unit probability across the range of photon
energies under study.
The photodissociation spectra for B ¼ A, C, and T show a broad peak at photon
energies below ca. 5.5 eV and increasing photodissociation cross sections at the
high energy side of the window of observation for all fragments formed [26]. The
latter is largely missing from the spectra of guanine-containing mononucleotides,
probably because the next-higher absorption band for this base is at higher energies,
outside of the accessible photon-energy range. The overall shape of the spectra is
independent of the phosphate-sugar configuration [27], but depends on the threshold energies and survival probabilities of the fragment ions in different decay
channels [26]. The shapes of the fragment spectra are very similar for the fragments
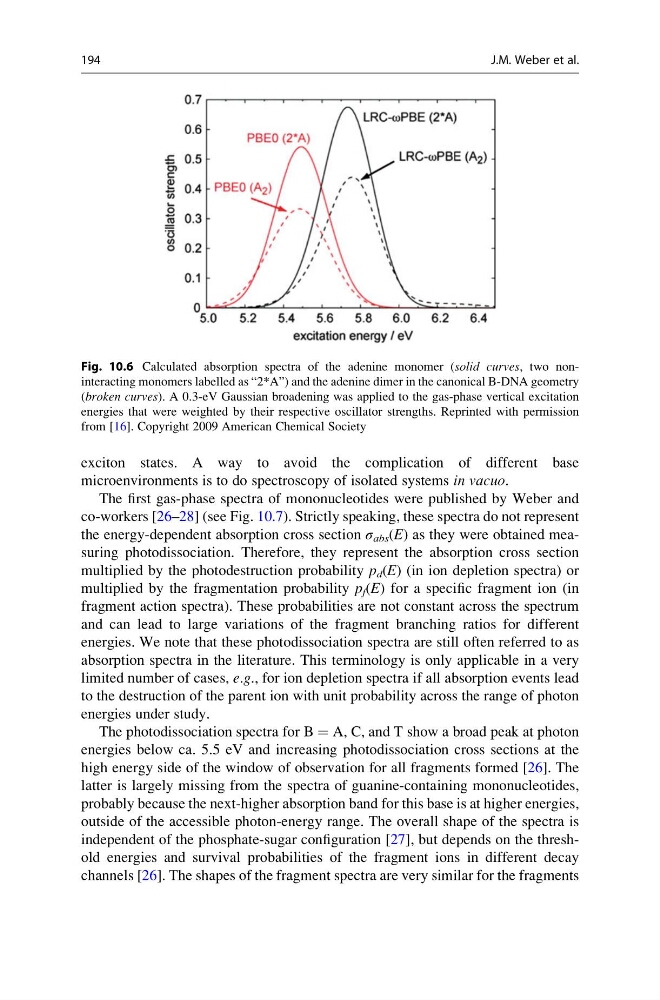
Fig. 10.6 Calculated absorption spectra of the adenine monomer (solid curves, two noninteracting monomers labelled as “2*A”) and the adenine dimer in the canonical B-DNA geometry
(broken curves). A 0.3-eV Gaussian broadening was applied to the gas-phase vertical excitation
energies that were weighted by their respective oscillator strengths. Reprinted with permission
from [16]. Copyright 2009 American Chemical Society
194
J.M. Weber et al.
microenvironments is to do spectroscopy of isolated systems in vacuo.
The first gas-phase spectra of mononucleotides were published by Weber and
co-workers [26–28] (see Fig. 10.7). Strictly speaking, these spectra do not represent
the energy-dependent absorption cross section σ abs (E) as they were obtained measuring photodissociation. Therefore, they represent the absorption cross section
multiplied by the photodestruction probability p d (E) (in ion depletion spectra) or
multiplied by the fragmentation probability p f (E) for a specific fragment ion (in
fragment action spectra). These probabilities are not constant across the spectrum
and can lead to large variations of the fragment branching ratios for different
energies. We note that these photodissociation spectra are still often referred to as
absorption spectra in the literature. This terminology is only applicable in a very
limited number of cases, e.g., for ion depletion spectra if all absorption events lead
to the destruction of the parent ion with unit probability across the range of photon
energies under study.
The photodissociation spectra for B ¼ A, C, and T show a broad peak at photon
energies below ca. 5.5 eV and increasing photodissociation cross sections at the
high energy side of the window of observation for all fragments formed [26]. The
latter is largely missing from the spectra of guanine-containing mononucleotides,
probably because the next-higher absorption band for this base is at higher energies,
outside of the accessible photon-energy range. The overall shape of the spectra is
independent of the phosphate-sugar configuration [27], but depends on the threshold energies and survival probabilities of the fragment ions in different decay
channels [26]. The shapes of the fragment spectra are very similar for the fragments
Fig. 10.6 Calculated absorption spectra of the adenine monomer (solid curves, two noninteracting monomers labelled as “2*A”) and the adenine dimer in the canonical B-DNA geometry
(broken curves). A 0.3-eV Gaussian broadening was applied to the gas-phase vertical excitation
energies that were weighted by their respective oscillator strengths. Reprinted with permission
from [16]. Copyright 2009 American Chemical Society
194
J.M. Weber et al.