

disturbance of the electronic structure of the porphyrin macrocycle (cf., Fig. 7.3).
As some of the protein spectra are slightly redshifted (by up to about 13 nm) relative
to that of the naked complex, it seems that such a perturbation lowers the energy
difference between the S 0 and S 1 states.
When methionine (Met) is bound to Fe(III)–heme
+ (NO), the absorption spectrum
displays two transitions; the Q 0 band at 563 Æ 5 nm and the Q 1 band at 524 Æ 5 nm
(Fig. 7.11) [14]. Thus the lowest-energy transition is not perturbed much by the axial
coordination of Met, but coupling to vibrational modes is enhanced. This is in
agreement with the fact that in general, two bands of similar magnitude are seen
for ferric heme nitrosyl proteins (6c heme), see for example Fig. 7.4.
A similar absorption spectrum is obtained when cysteine (Cys) is bound to
Fe(III)–heme
+
(NO), although the band is to some extent broadened at lower
energies. Based on protein data, a spectral redshift is expected if Cys binds as a
thiolate to the iron (and the amino group is protonated to account for the overall +1
charge in our experiments) (see Fig. 7.12). Hence two dominant isomers may be
present in the ion bunch, one of which has an iron thiolate ammonium ion structure
with the other adopting a binding mode similar to that in Fe(III)–heme
+
(Met)(NO).
Overall, the similarity between the above-mentioned gas-phase Q-band absorption maxima of 6c ferric heme nitrosyl cations and the band maxima of many
proteins indicates that the microenvironment of these protein cavities is almost
innocent in perturbing the electronic structure of the macrocycle, though redshifts
are observed for some proteins. Or more precisely, the difference between S 0 and S 1
does not depend much on the environment.
The spectroscopic data presented have been collected in Table 7.1.
1.5
2.0
2.5
3.0
3.5
4.0
0
50
100
150
200
250
Laser
Counts
Time after injection (ms)
l = 532 nm
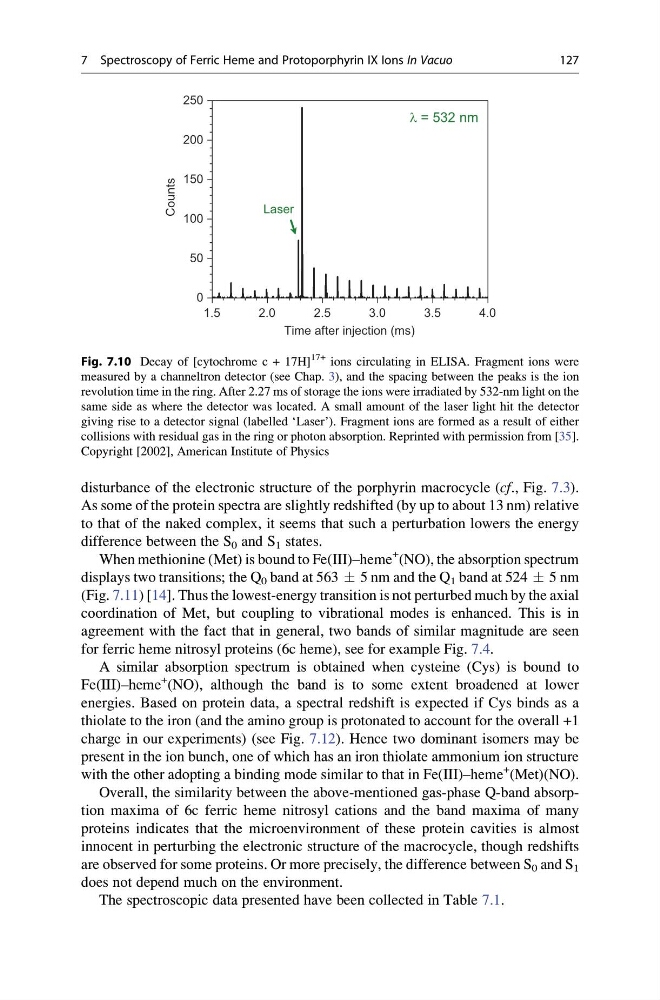
Fig. 7.10 Decay of [cytochrome c + 17H]
17+ ions circulating in ELISA. Fragment ions were
measured by a channeltron detector (see Chap. 3), and the spacing between the peaks is the ion
revolution time in the ring. After 2.27 ms of storage the ions were irradiated by 532-nm light on the
same side as where the detector was located. A small amount of the laser light hit the detector
giving rise to a detector signal (labelled ‘Laser’). Fragment ions are formed as a result of either
collisions with residual gas in the ring or photon absorption. Reprinted with permission from [35].
Copyright [2002], American Institute of Physics
7 Spectroscopy of Ferric Heme and Protoporphyrin IX Ions In Vacuo
127
As some of the protein spectra are slightly redshifted (by up to about 13 nm) relative
to that of the naked complex, it seems that such a perturbation lowers the energy
difference between the S 0 and S 1 states.
When methionine (Met) is bound to Fe(III)–heme
+ (NO), the absorption spectrum
displays two transitions; the Q 0 band at 563 Æ 5 nm and the Q 1 band at 524 Æ 5 nm
(Fig. 7.11) [14]. Thus the lowest-energy transition is not perturbed much by the axial
coordination of Met, but coupling to vibrational modes is enhanced. This is in
agreement with the fact that in general, two bands of similar magnitude are seen
for ferric heme nitrosyl proteins (6c heme), see for example Fig. 7.4.
A similar absorption spectrum is obtained when cysteine (Cys) is bound to
Fe(III)–heme
+
(NO), although the band is to some extent broadened at lower
energies. Based on protein data, a spectral redshift is expected if Cys binds as a
thiolate to the iron (and the amino group is protonated to account for the overall +1
charge in our experiments) (see Fig. 7.12). Hence two dominant isomers may be
present in the ion bunch, one of which has an iron thiolate ammonium ion structure
with the other adopting a binding mode similar to that in Fe(III)–heme
+
(Met)(NO).
Overall, the similarity between the above-mentioned gas-phase Q-band absorption maxima of 6c ferric heme nitrosyl cations and the band maxima of many
proteins indicates that the microenvironment of these protein cavities is almost
innocent in perturbing the electronic structure of the macrocycle, though redshifts
are observed for some proteins. Or more precisely, the difference between S 0 and S 1
does not depend much on the environment.
The spectroscopic data presented have been collected in Table 7.1.
1.5
2.0
2.5
3.0
3.5
4.0
0
50
100
150
200
250
Laser
Counts
Time after injection (ms)
l = 532 nm
Fig. 7.10 Decay of [cytochrome c + 17H]
17+ ions circulating in ELISA. Fragment ions were
measured by a channeltron detector (see Chap. 3), and the spacing between the peaks is the ion
revolution time in the ring. After 2.27 ms of storage the ions were irradiated by 532-nm light on the
same side as where the detector was located. A small amount of the laser light hit the detector
giving rise to a detector signal (labelled ‘Laser’). Fragment ions are formed as a result of either
collisions with residual gas in the ring or photon absorption. Reprinted with permission from [35].
Copyright [2002], American Institute of Physics
7 Spectroscopy of Ferric Heme and Protoporphyrin IX Ions In Vacuo
127