

γ 1, 2 ¼
1
2
k 1 þ k À1 þ k 2
ð
Þ Ç
1
2
ffiffiffiffiffiffiffiffiffiffiffiffiffiffiffiffiffiffiffiffiffiffiffiffiffiffiffiffiffiffiffiffiffiffiffiffiffiffiffiffiffiffiffiffiffiffiffiffiffi
k 1 þ k À1 þ k 2
ð
Þ
2 þ 4k 1 k 2
q
ffi
2k 1 þ k À1
2
Ç
ffiffiffiffiffiffiffiffiffiffiffiffiffiffiffiffi ffi
k
2
À1
þ4k
2
1
q
2
(5.7)
where k 1 and k 2 are the rate constants along the two alternative branches. Provided
that k 1 is almost equal to k 2 , the Eq. (5.7) boils down to the right-hand side
expression. The analysis of this expression shows that the IC lifetime estimated
as inverse of 2k 1 lies in between the corresponding values defined as inverse of
γ 1 and γ 2 .
At low excitation energies, the VAD rate is determined by the energy transfer to
the lowest-frequency emission-active mode of 849 cm
À1 (0.105 eV). The amount of
energy that is required for VAD corresponds to the 0–1 excitation energy for this
mode. This enables a nearly perfect resonance between the S 1 (ν ¼ 1) and D 0 (ν ¼ 0)
states (see Fig. 5.15). The rate constant for the energy transfer may then statistically
be estimated. It is proportional to the total number of vibrational states, where the
emission-active mode is excited at least to the first level. And it is reciprocally
proportional to the density of all states at the energy E. Note, that the VAD
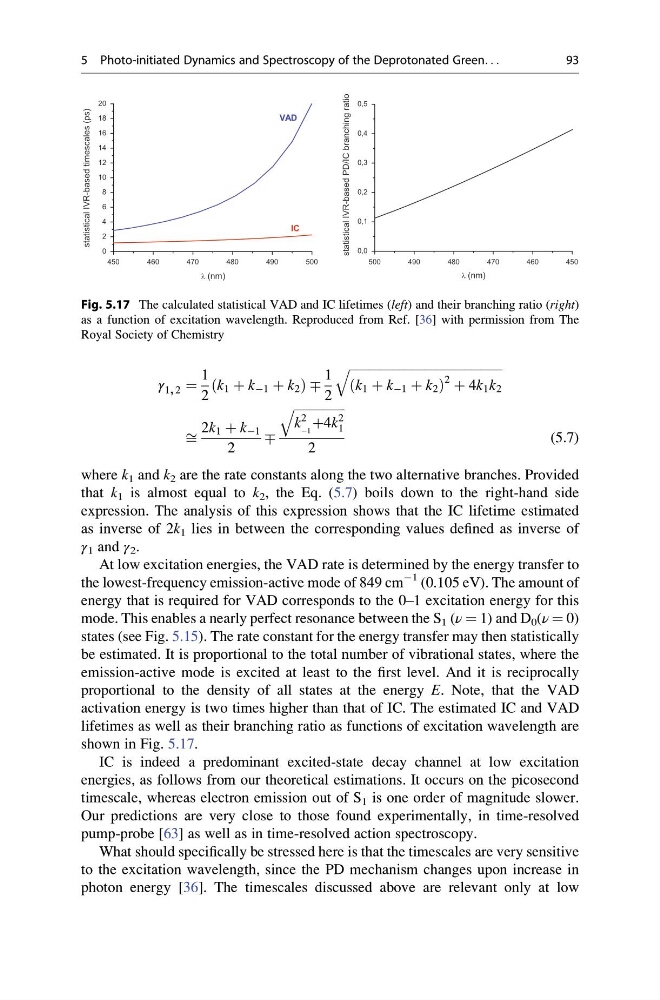
activation energy is two times higher than that of IC. The estimated IC and VAD
lifetimes as well as their branching ratio as functions of excitation wavelength are
shown in Fig. 5.17.
IC is indeed a predominant excited-state decay channel at low excitation
energies, as follows from our theoretical estimations. It occurs on the picosecond
timescale, whereas electron emission out of S 1 is one order of magnitude slower.
Our predictions are very close to those found experimentally, in time-resolved
pump-probe [63] as well as in time-resolved action spectroscopy.
What should specifically be stressed here is that the timescales are very sensitive
to the excitation wavelength, since the PD mechanism changes upon increase in
photon energy [36]. The timescales discussed above are relevant only at low
450
460
470
480
490
500
0
2
4
6
8
10
12
14
16
18
20
IC
statistical IVR-based timescales (ps)
(nm)
VAD
5 0 0
4 9 0
4 8 0
4 7 0
4 6 0
4 5 0
0,0
0,1
0,2
0,3
0,4
0,5
statistical IVR-based PD/IC branching ratio
(nm)
Fig. 5.17 The calculated statistical VAD and IC lifetimes (left) and their branching ratio (right)
as a function of excitation wavelength. Reproduced from Ref. [36] with permission from The
Royal Society of Chemistry
5 Photo-initiated Dynamics and Spectroscopy of the Deprotonated Green. . .
93
1
2
k 1 þ k À1 þ k 2
ð
Þ Ç
1
2
ffiffiffiffiffiffiffiffiffiffiffiffiffiffiffiffiffiffiffiffiffiffiffiffiffiffiffiffiffiffiffiffiffiffiffiffiffiffiffiffiffiffiffiffiffiffiffiffiffi
k 1 þ k À1 þ k 2
ð
Þ
2 þ 4k 1 k 2
q
ffi
2k 1 þ k À1
2
Ç
ffiffiffiffiffiffiffiffiffiffiffiffiffiffiffiffi ffi
k
2
À1
þ4k
2
1
q
2
(5.7)
where k 1 and k 2 are the rate constants along the two alternative branches. Provided
that k 1 is almost equal to k 2 , the Eq. (5.7) boils down to the right-hand side
expression. The analysis of this expression shows that the IC lifetime estimated
as inverse of 2k 1 lies in between the corresponding values defined as inverse of
γ 1 and γ 2 .
At low excitation energies, the VAD rate is determined by the energy transfer to
the lowest-frequency emission-active mode of 849 cm
À1 (0.105 eV). The amount of
energy that is required for VAD corresponds to the 0–1 excitation energy for this
mode. This enables a nearly perfect resonance between the S 1 (ν ¼ 1) and D 0 (ν ¼ 0)
states (see Fig. 5.15). The rate constant for the energy transfer may then statistically
be estimated. It is proportional to the total number of vibrational states, where the
emission-active mode is excited at least to the first level. And it is reciprocally
proportional to the density of all states at the energy E. Note, that the VAD
activation energy is two times higher than that of IC. The estimated IC and VAD
lifetimes as well as their branching ratio as functions of excitation wavelength are
shown in Fig. 5.17.
IC is indeed a predominant excited-state decay channel at low excitation
energies, as follows from our theoretical estimations. It occurs on the picosecond
timescale, whereas electron emission out of S 1 is one order of magnitude slower.
Our predictions are very close to those found experimentally, in time-resolved
pump-probe [63] as well as in time-resolved action spectroscopy.
What should specifically be stressed here is that the timescales are very sensitive
to the excitation wavelength, since the PD mechanism changes upon increase in
photon energy [36]. The timescales discussed above are relevant only at low
450
460
470
480
490
500
0
2
4
6
8
10
12
14
16
18
20
IC
statistical IVR-based timescales (ps)
(nm)
VAD
5 0 0
4 9 0
4 8 0
4 7 0
4 6 0
4 5 0
0,0
0,1
0,2
0,3
0,4
0,5
statistical IVR-based PD/IC branching ratio
(nm)
Fig. 5.17 The calculated statistical VAD and IC lifetimes (left) and their branching ratio (right)
as a function of excitation wavelength. Reproduced from Ref. [36] with permission from The
Royal Society of Chemistry
5 Photo-initiated Dynamics and Spectroscopy of the Deprotonated Green. . .
93