

518
F. Gentile et al.
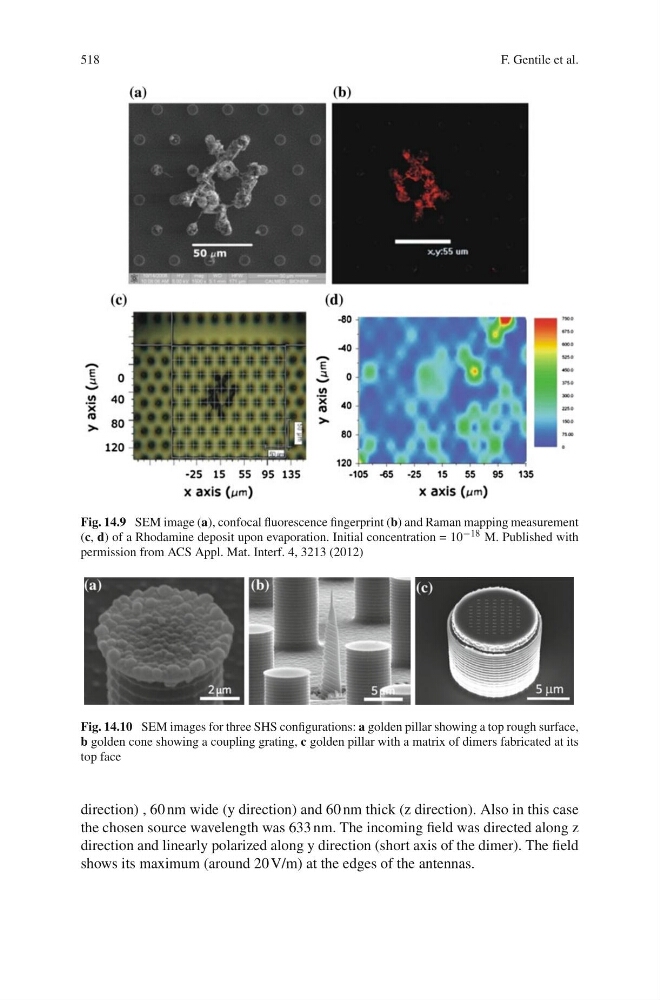
Fig. 14.9 SEM image (a), confocal fluorescence fingerprint (b) and Raman mapping measurement
(c, d) of a Rhodamine deposit upon evaporation. Initial concentration = 10 −18 M. Published with
permission from ACS Appl. Mat. Interf. 4, 3213 (2012)
Fig. 14.10 SEM images for three SHS configurations: a golden pillar showing a top rough surface,
b golden cone showing a coupling grating, c golden pillar with a matrix of dimers fabricated at its
top face
direction) , 60 nm wide (y direction) and 60 nm thick (z direction). Also in this case
the chosen source wavelength was 633 nm. The incoming field was directed along z
direction and linearly polarized along y direction (short axis of the dimer). The field
shows its maximum (around 20 V/m) at the edges of the antennas.
F. Gentile et al.
Fig. 14.9 SEM image (a), confocal fluorescence fingerprint (b) and Raman mapping measurement
(c, d) of a Rhodamine deposit upon evaporation. Initial concentration = 10 −18 M. Published with
permission from ACS Appl. Mat. Interf. 4, 3213 (2012)
Fig. 14.10 SEM images for three SHS configurations: a golden pillar showing a top rough surface,
b golden cone showing a coupling grating, c golden pillar with a matrix of dimers fabricated at its
top face
direction) , 60 nm wide (y direction) and 60 nm thick (z direction). Also in this case
the chosen source wavelength was 633 nm. The incoming field was directed along z
direction and linearly polarized along y direction (short axis of the dimer). The field
shows its maximum (around 20 V/m) at the edges of the antennas.