

13 Spinoptics in Plasmonics
469
The intensity distributions in the cavity described above for incident spins λ +
and λ − are indistinguishable, as opposed to the experimental results obtained in the
spiral cavity (see Fig. 13.1). In the latter, in addition to the geometric phase of the
SPPs due to a polarization-dependent coupling, a dynamic phase arises as a result of
a space-variant path difference. This dynamic phase is induced by the grooves’ spiral
pitch. The overall phase in the spiral cavity is the sum of the geometric and dynamic
phases, γ = γ g + γ d and the total topological charge of the plasmonic vortex is
l = − (λ ± + m), where m is the spiral pitch in the units of SPP wavelength. For the
specific case when m = 1, the microcavity mode obeys the form of J 0
k p r
for
|λ − ≈ and of exp (−i2π) J 2
k p r
for |λ + ≈. Consequently, for |λ − ≈ illumination the
resultant field distribution possesses no phase singularity in the center, as opposed to
the |λ + ≈ illumination case, which agrees with the experimental results presented in
Fig. 13.1. The formation of the geometric phase is, therefore, the origin of the spindependent intensity distribution in the spiral cavity, and may lead to other spin-based
phenomena in plasmonic systems.
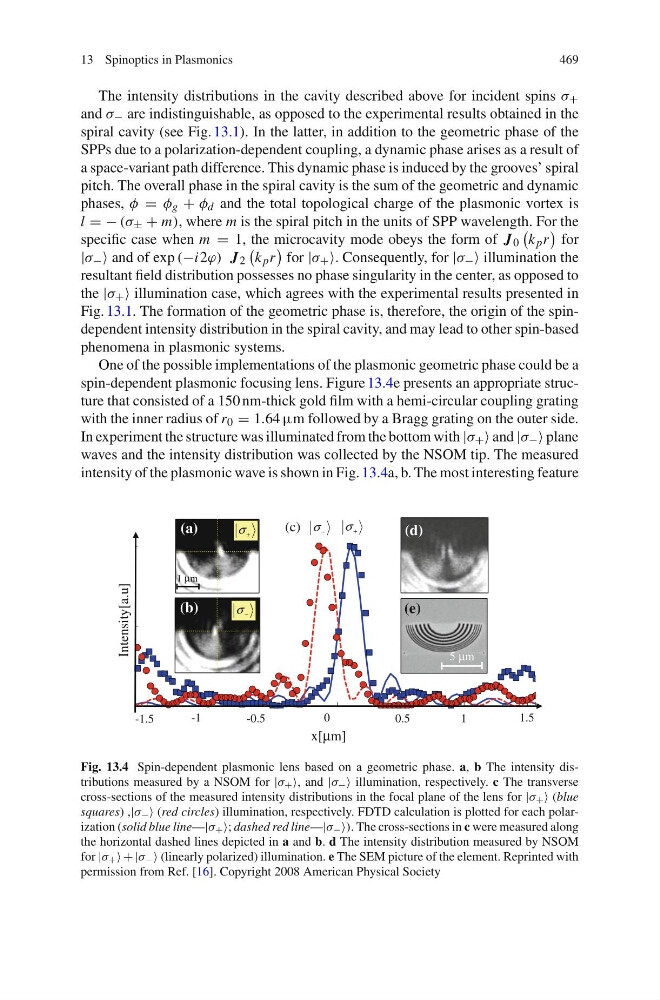
One of the possible implementations of the plasmonic geometric phase could be a
spin-dependent plasmonic focusing lens. Figure 13.4e presents an appropriate structure that consisted of a 150 nm-thick gold film with a hemi-circular coupling grating
with the inner radius of r 0 = 1.64 µm followed by a Bragg grating on the outer side.
In experiment the structure was illuminated from the bottom with |λ + ≈ and |λ − ≈ plane
waves and the intensity distribution was collected by the NSOM tip. The measured
intensity of the plasmonic wave is shown in Fig. 13.4a, b. The most interesting feature
x[μm]
-1.5
1.5
(c)
Intensity[a.u]
1
0.5
5 μm
-1
-0.5
0
−
σ
(b)
−
σ
+
σ
(d)
(e)
+
σ
(a)
1 μm
Fig. 13.4 Spin-dependent plasmonic lens based on a geometric phase. a, b The intensity distributions measured by a NSOM for |λ + ≈, and |λ − ≈ illumination, respectively. c The transverse
cross-sections of the measured intensity distributions in the focal plane of the lens for |λ + ≈ (blue
squares) ,|λ − ≈ (red circles) illumination, respectively. FDTD calculation is plotted for each polarization (solid blue line—|λ + ≈; dashed red line—|λ − ≈). The cross-sections in c were measured along
the horizontal dashed lines depicted in a and b. d The intensity distribution measured by NSOM
for |λ + ≈ + |λ − ≈ (linearly polarized) illumination. e The SEM picture of the element. Reprinted with
permission from Ref. [16]. Copyright 2008 American Physical Society
469
The intensity distributions in the cavity described above for incident spins λ +
and λ − are indistinguishable, as opposed to the experimental results obtained in the
spiral cavity (see Fig. 13.1). In the latter, in addition to the geometric phase of the
SPPs due to a polarization-dependent coupling, a dynamic phase arises as a result of
a space-variant path difference. This dynamic phase is induced by the grooves’ spiral
pitch. The overall phase in the spiral cavity is the sum of the geometric and dynamic
phases, γ = γ g + γ d and the total topological charge of the plasmonic vortex is
l = − (λ ± + m), where m is the spiral pitch in the units of SPP wavelength. For the
specific case when m = 1, the microcavity mode obeys the form of J 0
k p r
for
|λ − ≈ and of exp (−i2π) J 2
k p r
for |λ + ≈. Consequently, for |λ − ≈ illumination the
resultant field distribution possesses no phase singularity in the center, as opposed to
the |λ + ≈ illumination case, which agrees with the experimental results presented in
Fig. 13.1. The formation of the geometric phase is, therefore, the origin of the spindependent intensity distribution in the spiral cavity, and may lead to other spin-based
phenomena in plasmonic systems.
One of the possible implementations of the plasmonic geometric phase could be a
spin-dependent plasmonic focusing lens. Figure 13.4e presents an appropriate structure that consisted of a 150 nm-thick gold film with a hemi-circular coupling grating
with the inner radius of r 0 = 1.64 µm followed by a Bragg grating on the outer side.
In experiment the structure was illuminated from the bottom with |λ + ≈ and |λ − ≈ plane
waves and the intensity distribution was collected by the NSOM tip. The measured
intensity of the plasmonic wave is shown in Fig. 13.4a, b. The most interesting feature
x[μm]
-1.5
1.5
(c)
Intensity[a.u]
1
0.5
5 μm
-1
-0.5
0
−
σ
(b)
−
σ
+
σ
(d)
(e)
+
σ
(a)
1 μm
Fig. 13.4 Spin-dependent plasmonic lens based on a geometric phase. a, b The intensity distributions measured by a NSOM for |λ + ≈, and |λ − ≈ illumination, respectively. c The transverse
cross-sections of the measured intensity distributions in the focal plane of the lens for |λ + ≈ (blue
squares) ,|λ − ≈ (red circles) illumination, respectively. FDTD calculation is plotted for each polarization (solid blue line—|λ + ≈; dashed red line—|λ − ≈). The cross-sections in c were measured along
the horizontal dashed lines depicted in a and b. d The intensity distribution measured by NSOM
for |λ + ≈ + |λ − ≈ (linearly polarized) illumination. e The SEM picture of the element. Reprinted with
permission from Ref. [16]. Copyright 2008 American Physical Society