

13 Spinoptics in Plasmonics
465
π
0
−π
π
0
−π
4μm
Dark spot
1μm
Bright spot
k 0
±
E z
detec tor
NSOM
Laser
QWP
k p
k p
Au
SiO 2
+
−
r
z
1 μm
σ
σ
σ
(a)
(c)
(e)
(g)
(d)
(f)
(h)
(b)
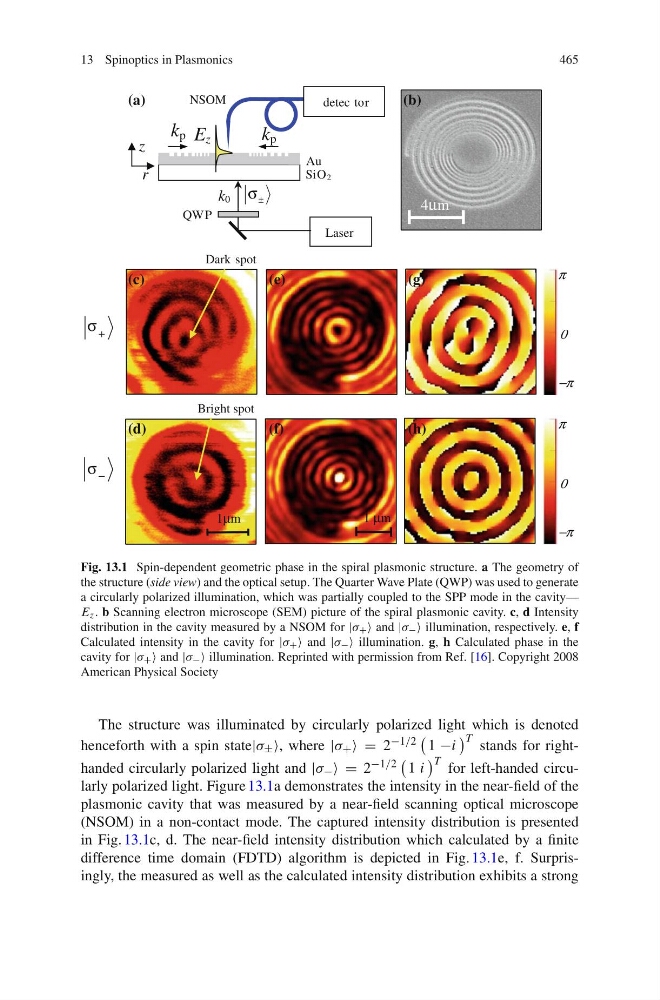
Fig. 13.1 Spin-dependent geometric phase in the spiral plasmonic structure. a The geometry of
the structure (side view) and the optical setup. The Quarter Wave Plate (QWP) was used to generate
a circularly polarized illumination, which was partially coupled to the SPP mode in the cavity—
E z . b Scanning electron microscope (SEM) picture of the spiral plasmonic cavity. c, d Intensity
distribution in the cavity measured by a NSOM for |λ + ≈ and |λ − ≈ illumination, respectively. e, f
Calculated intensity in the cavity for |λ + ≈ and |λ − ≈ illumination. g, h Calculated phase in the
cavity for |λ + ≈ and |λ − ≈ illumination. Reprinted with permission from Ref. [16]. Copyright 2008
American Physical Society
The structure was illuminated by circularly polarized light which is denoted
henceforth with a spin state|λ ± ≈, where |λ + ≈ = 2 −1/2
1 −i
T stands for righthanded circularly polarized light and |λ − ≈ = 2 −1/2
1 i
T for left-handed circularly polarized light. Figure 13.1a demonstrates the intensity in the near-field of the
plasmonic cavity that was measured by a near-field scanning optical microscope
(NSOM) in a non-contact mode. The captured intensity distribution is presented
in Fig. 13.1c, d. The near-field intensity distribution which calculated by a finite
difference time domain (FDTD) algorithm is depicted in Fig. 13.1e, f. Surprisingly, the measured as well as the calculated intensity distribution exhibits a strong
465
π
0
−π
π
0
−π
4μm
Dark spot
1μm
Bright spot
k 0
±
E z
detec tor
NSOM
Laser
QWP
k p
k p
Au
SiO 2
+
−
r
z
1 μm
σ
σ
σ
(a)
(c)
(e)
(g)
(d)
(f)
(h)
(b)
Fig. 13.1 Spin-dependent geometric phase in the spiral plasmonic structure. a The geometry of
the structure (side view) and the optical setup. The Quarter Wave Plate (QWP) was used to generate
a circularly polarized illumination, which was partially coupled to the SPP mode in the cavity—
E z . b Scanning electron microscope (SEM) picture of the spiral plasmonic cavity. c, d Intensity
distribution in the cavity measured by a NSOM for |λ + ≈ and |λ − ≈ illumination, respectively. e, f
Calculated intensity in the cavity for |λ + ≈ and |λ − ≈ illumination. g, h Calculated phase in the
cavity for |λ + ≈ and |λ − ≈ illumination. Reprinted with permission from Ref. [16]. Copyright 2008
American Physical Society
The structure was illuminated by circularly polarized light which is denoted
henceforth with a spin state|λ ± ≈, where |λ + ≈ = 2 −1/2
1 −i
T stands for righthanded circularly polarized light and |λ − ≈ = 2 −1/2
1 i
T for left-handed circularly polarized light. Figure 13.1a demonstrates the intensity in the near-field of the
plasmonic cavity that was measured by a near-field scanning optical microscope
(NSOM) in a non-contact mode. The captured intensity distribution is presented
in Fig. 13.1c, d. The near-field intensity distribution which calculated by a finite
difference time domain (FDTD) algorithm is depicted in Fig. 13.1e, f. Surprisingly, the measured as well as the calculated intensity distribution exhibits a strong