

392
P. Lalanne and H. Liu
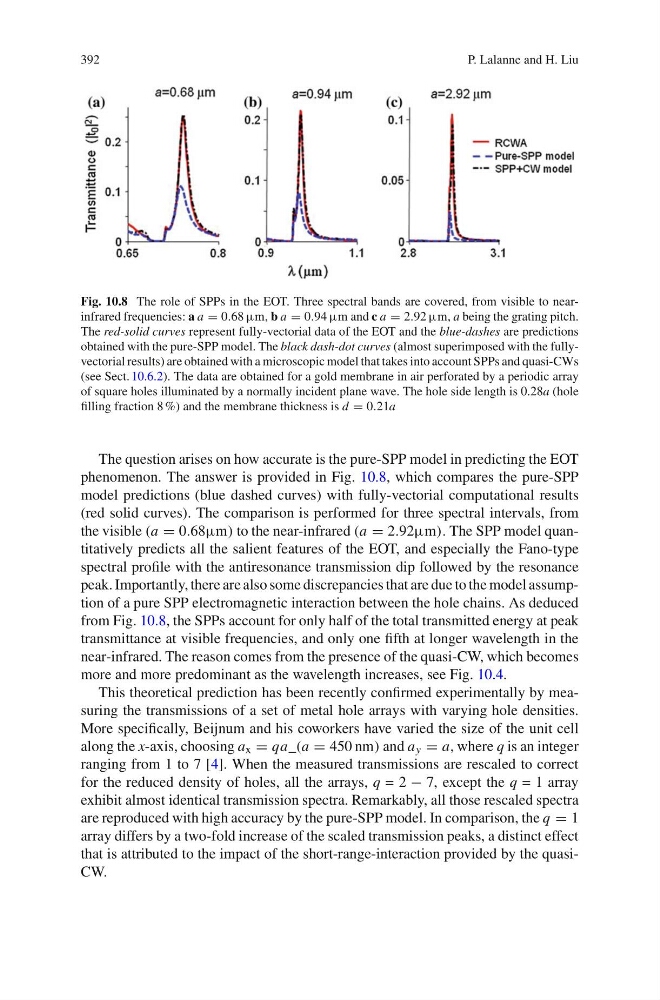
Fig. 10.8 The role of SPPs in the EOT. Three spectral bands are covered, from visible to nearinfrared frequencies: a a = 0.68 μm, b a = 0.94 μm and c a = 2.92 μm, a being the grating pitch.
The red-solid curves represent fully-vectorial data of the EOT and the blue-dashes are predictions
obtained with the pure-SPP model. The black dash-dot curves (almost superimposed with the fullyvectorial results) are obtained with a microscopic model that takes into account SPPs and quasi-CWs
(see Sect. 10.6.2). The data are obtained for a gold membrane in air perforated by a periodic array
of square holes illuminated by a normally incident plane wave. The hole side length is 0.28a (hole
filling fraction 8 %) and the membrane thickness is d = 0.21a
The question arises on how accurate is the pure-SPP model in predicting the EOT
phenomenon. The answer is provided in Fig. 10.8, which compares the pure-SPP
model predictions (blue dashed curves) with fully-vectorial computational results
(red solid curves). The comparison is performed for three spectral intervals, from
the visible (a = 0.68μm) to the near-infrared (a = 2.92μm). The SPP model quantitatively predicts all the salient features of the EOT, and especially the Fano-type
spectral profile with the antiresonance transmission dip followed by the resonance
peak. Importantly, there are also some discrepancies that are due to the model assumption of a pure SPP electromagnetic interaction between the hole chains. As deduced
from Fig. 10.8, the SPPs account for only half of the total transmitted energy at peak
transmittance at visible frequencies, and only one fifth at longer wavelength in the
near-infrared. The reason comes from the presence of the quasi-CW, which becomes
more and more predominant as the wavelength increases, see Fig. 10.4.
This theoretical prediction has been recently confirmed experimentally by measuring the transmissions of a set of metal hole arrays with varying hole densities.
More specifically, Beijnum and his coworkers have varied the size of the unit cell
along the x-axis, choosing a x = qa_(a = 450 nm) and a y = a, where q is an integer
ranging from 1 to 7 [4]. When the measured transmissions are rescaled to correct
for the reduced density of holes, all the arrays, q = 2 − 7, except the q = 1 array
exhibit almost identical transmission spectra. Remarkably, all those rescaled spectra
are reproduced with high accuracy by the pure-SPP model. In comparison, the q = 1
array differs by a two-fold increase of the scaled transmission peaks, a distinct effect
that is attributed to the impact of the short-range-interaction provided by the quasiCW.
P. Lalanne and H. Liu
Fig. 10.8 The role of SPPs in the EOT. Three spectral bands are covered, from visible to nearinfrared frequencies: a a = 0.68 μm, b a = 0.94 μm and c a = 2.92 μm, a being the grating pitch.
The red-solid curves represent fully-vectorial data of the EOT and the blue-dashes are predictions
obtained with the pure-SPP model. The black dash-dot curves (almost superimposed with the fullyvectorial results) are obtained with a microscopic model that takes into account SPPs and quasi-CWs
(see Sect. 10.6.2). The data are obtained for a gold membrane in air perforated by a periodic array
of square holes illuminated by a normally incident plane wave. The hole side length is 0.28a (hole
filling fraction 8 %) and the membrane thickness is d = 0.21a
The question arises on how accurate is the pure-SPP model in predicting the EOT
phenomenon. The answer is provided in Fig. 10.8, which compares the pure-SPP
model predictions (blue dashed curves) with fully-vectorial computational results
(red solid curves). The comparison is performed for three spectral intervals, from
the visible (a = 0.68μm) to the near-infrared (a = 2.92μm). The SPP model quantitatively predicts all the salient features of the EOT, and especially the Fano-type
spectral profile with the antiresonance transmission dip followed by the resonance
peak. Importantly, there are also some discrepancies that are due to the model assumption of a pure SPP electromagnetic interaction between the hole chains. As deduced
from Fig. 10.8, the SPPs account for only half of the total transmitted energy at peak
transmittance at visible frequencies, and only one fifth at longer wavelength in the
near-infrared. The reason comes from the presence of the quasi-CW, which becomes
more and more predominant as the wavelength increases, see Fig. 10.4.
This theoretical prediction has been recently confirmed experimentally by measuring the transmissions of a set of metal hole arrays with varying hole densities.
More specifically, Beijnum and his coworkers have varied the size of the unit cell
along the x-axis, choosing a x = qa_(a = 450 nm) and a y = a, where q is an integer
ranging from 1 to 7 [4]. When the measured transmissions are rescaled to correct
for the reduced density of holes, all the arrays, q = 2 − 7, except the q = 1 array
exhibit almost identical transmission spectra. Remarkably, all those rescaled spectra
are reproduced with high accuracy by the pure-SPP model. In comparison, the q = 1
array differs by a two-fold increase of the scaled transmission peaks, a distinct effect
that is attributed to the impact of the short-range-interaction provided by the quasiCW.