

10 Waves on Subwalength Metallic Surfaces: A Microscopic View Point
387
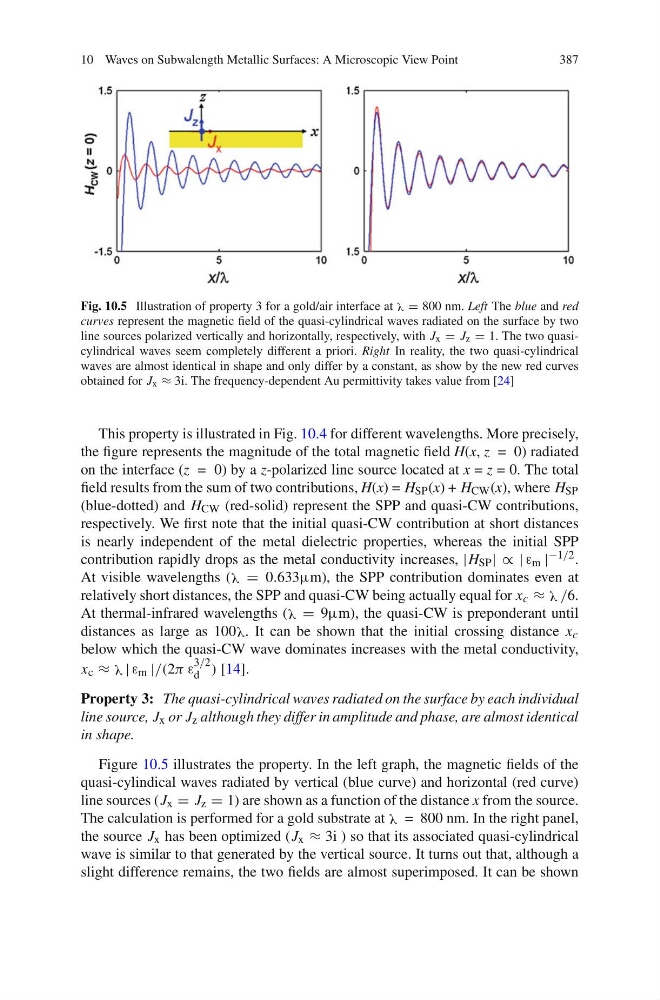
Fig. 10.5 Illustration of property 3 for a gold/air interface at λ = 800 nm. Left The blue and red
curves represent the magnetic field of the quasi-cylindrical waves radiated on the surface by two
line sources polarized vertically and horizontally, respectively, with J x = J z = 1. The two quasicylindrical waves seem completely different a priori. Right In reality, the two quasi-cylindrical
waves are almost identical in shape and only differ by a constant, as show by the new red curves
obtained for J x ≈ 3i. The frequency-dependent Au permittivity takes value from [24]
This property is illustrated in Fig. 10.4 for different wavelengths. More precisely,
the figure represents the magnitude of the total magnetic field H(x, z = 0) radiated
on the interface (z = 0) by a z-polarized line source located at x = z = 0. The total
field results from the sum of two contributions, H(x) = H SP (x) + H CW (x), where H SP
(blue-dotted) and H CW (red-solid) represent the SPP and quasi-CW contributions,
respectively. We first note that the initial quasi-CW contribution at short distances
is nearly independent of the metal dielectric properties, whereas the initial SPP
contribution rapidly drops as the metal conductivity increases, |H SP | ∼ | ε m | −1/2 .
At visible wavelengths (λ = 0.633μm), the SPP contribution dominates even at
relatively short distances, the SPP and quasi-CW being actually equal for x c ≈ λ /6.
At thermal-infrared wavelengths (λ = 9μm), the quasi-CW is preponderant until
distances as large as 100λ. It can be shown that the initial crossing distance x c
below which the quasi-CW wave dominates increases with the metal conductivity,
x c ≈ λ | ε m |/(2ε ε
3/2
d ) [14].
Property 3: The quasi-cylindrical waves radiated on the surface by each individual
line source, J x or J z although they differ in amplitude and phase, are almost identical
in shape.
Figure 10.5 illustrates the property. In the left graph, the magnetic fields of the
quasi-cylindical waves radiated by vertical (blue curve) and horizontal (red curve)
line sources (J x = J z = 1) are shown as a function of the distance x from the source.
The calculation is performed for a gold substrate at λ = 800 nm. In the right panel,
the source J x has been optimized (J x ≈ 3i ) so that its associated quasi-cylindrical
wave is similar to that generated by the vertical source. It turns out that, although a
slight difference remains, the two fields are almost superimposed. It can be shown
387
Fig. 10.5 Illustration of property 3 for a gold/air interface at λ = 800 nm. Left The blue and red
curves represent the magnetic field of the quasi-cylindrical waves radiated on the surface by two
line sources polarized vertically and horizontally, respectively, with J x = J z = 1. The two quasicylindrical waves seem completely different a priori. Right In reality, the two quasi-cylindrical
waves are almost identical in shape and only differ by a constant, as show by the new red curves
obtained for J x ≈ 3i. The frequency-dependent Au permittivity takes value from [24]
This property is illustrated in Fig. 10.4 for different wavelengths. More precisely,
the figure represents the magnitude of the total magnetic field H(x, z = 0) radiated
on the interface (z = 0) by a z-polarized line source located at x = z = 0. The total
field results from the sum of two contributions, H(x) = H SP (x) + H CW (x), where H SP
(blue-dotted) and H CW (red-solid) represent the SPP and quasi-CW contributions,
respectively. We first note that the initial quasi-CW contribution at short distances
is nearly independent of the metal dielectric properties, whereas the initial SPP
contribution rapidly drops as the metal conductivity increases, |H SP | ∼ | ε m | −1/2 .
At visible wavelengths (λ = 0.633μm), the SPP contribution dominates even at
relatively short distances, the SPP and quasi-CW being actually equal for x c ≈ λ /6.
At thermal-infrared wavelengths (λ = 9μm), the quasi-CW is preponderant until
distances as large as 100λ. It can be shown that the initial crossing distance x c
below which the quasi-CW wave dominates increases with the metal conductivity,
x c ≈ λ | ε m |/(2ε ε
3/2
d ) [14].
Property 3: The quasi-cylindrical waves radiated on the surface by each individual
line source, J x or J z although they differ in amplitude and phase, are almost identical
in shape.
Figure 10.5 illustrates the property. In the left graph, the magnetic fields of the
quasi-cylindical waves radiated by vertical (blue curve) and horizontal (red curve)
line sources (J x = J z = 1) are shown as a function of the distance x from the source.
The calculation is performed for a gold substrate at λ = 800 nm. In the right panel,
the source J x has been optimized (J x ≈ 3i ) so that its associated quasi-cylindrical
wave is similar to that generated by the vertical source. It turns out that, although a
slight difference remains, the two fields are almost superimposed. It can be shown