

9 Aperiodic Order in Nanoplasmonics
361
duced a novel approach to label-free optical biosensing based on micro-spectroscopy
and spatial correlation analysis of structural color patterns excited by white light
illumination in DANS metal-dielectric surfaces [85, 86]. In contrast to traditional
photonic gratings or photonic crystals sensors (which efficiently trap light within
small-volumes), aperiodic scattering sensors sustain distinctive resonances localized
over larger surface areas. These structural resonances, known as critical modes, are
described by highly fluctuating field profiles (i.e., best described by multi-fractal
analysis) and have a dense spectrum, which result in efficient photon trapping and
surface interactions through higher-order multiple scattering processes. These features thereby strongly enhance the sensitivity of DANS surfaces to small refractive
index changes. The complex spatial patterns of critical modes in these structures offer
the potential to engineer structural color sensing with spatially localized patterns at
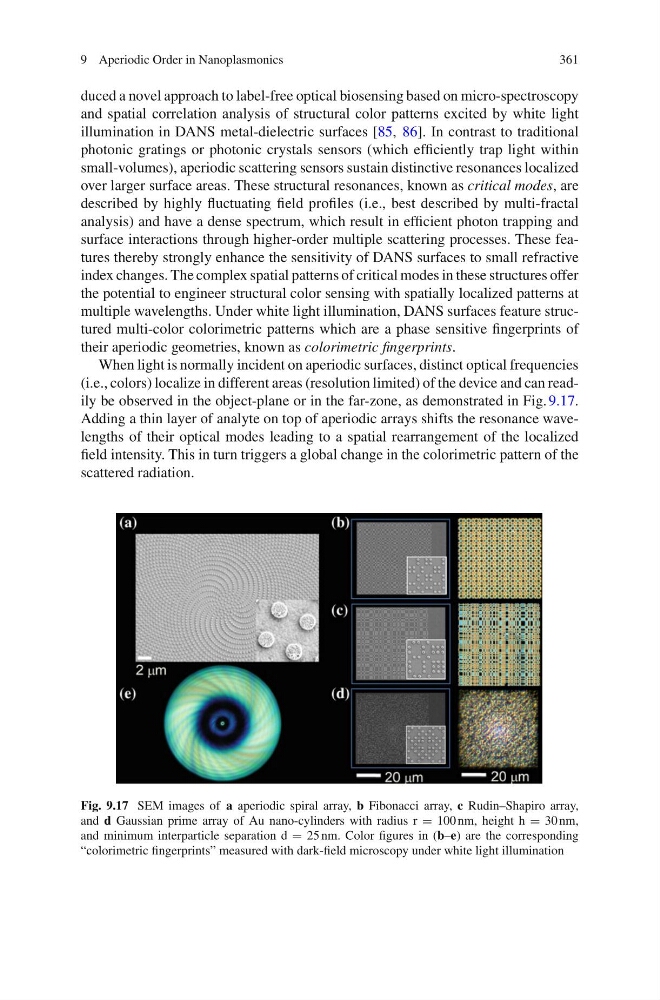
multiple wavelengths. Under white light illumination, DANS surfaces feature structured multi-color colorimetric patterns which are a phase sensitive fingerprints of
their aperiodic geometries, known as colorimetric fingerprints.
When light is normally incident on aperiodic surfaces, distinct optical frequencies
(i.e., colors) localize in different areas (resolution limited) of the device and can readily be observed in the object-plane or in the far-zone, as demonstrated in Fig. 9.17.
Adding a thin layer of analyte on top of aperiodic arrays shifts the resonance wavelengths of their optical modes leading to a spatial rearrangement of the localized
field intensity. This in turn triggers a global change in the colorimetric pattern of the
scattered radiation.
Fig. 9.17 SEM images of a aperiodic spiral array, b Fibonacci array, c Rudin–Shapiro array,
and d Gaussian prime array of Au nano-cylinders with radius r = 100 nm, height h = 30 nm,
and minimum interparticle separation d = 25 nm. Color figures in (b–e) are the corresponding
“colorimetric fingerprints” measured with dark-field microscopy under white light illumination
361
duced a novel approach to label-free optical biosensing based on micro-spectroscopy
and spatial correlation analysis of structural color patterns excited by white light
illumination in DANS metal-dielectric surfaces [85, 86]. In contrast to traditional
photonic gratings or photonic crystals sensors (which efficiently trap light within
small-volumes), aperiodic scattering sensors sustain distinctive resonances localized
over larger surface areas. These structural resonances, known as critical modes, are
described by highly fluctuating field profiles (i.e., best described by multi-fractal
analysis) and have a dense spectrum, which result in efficient photon trapping and
surface interactions through higher-order multiple scattering processes. These features thereby strongly enhance the sensitivity of DANS surfaces to small refractive
index changes. The complex spatial patterns of critical modes in these structures offer
the potential to engineer structural color sensing with spatially localized patterns at
multiple wavelengths. Under white light illumination, DANS surfaces feature structured multi-color colorimetric patterns which are a phase sensitive fingerprints of
their aperiodic geometries, known as colorimetric fingerprints.
When light is normally incident on aperiodic surfaces, distinct optical frequencies
(i.e., colors) localize in different areas (resolution limited) of the device and can readily be observed in the object-plane or in the far-zone, as demonstrated in Fig. 9.17.
Adding a thin layer of analyte on top of aperiodic arrays shifts the resonance wavelengths of their optical modes leading to a spatial rearrangement of the localized
field intensity. This in turn triggers a global change in the colorimetric pattern of the
scattered radiation.
Fig. 9.17 SEM images of a aperiodic spiral array, b Fibonacci array, c Rudin–Shapiro array,
and d Gaussian prime array of Au nano-cylinders with radius r = 100 nm, height h = 30 nm,
and minimum interparticle separation d = 25 nm. Color figures in (b–e) are the corresponding
“colorimetric fingerprints” measured with dark-field microscopy under white light illumination