

9 Aperiodic Order in Nanoplasmonics
359
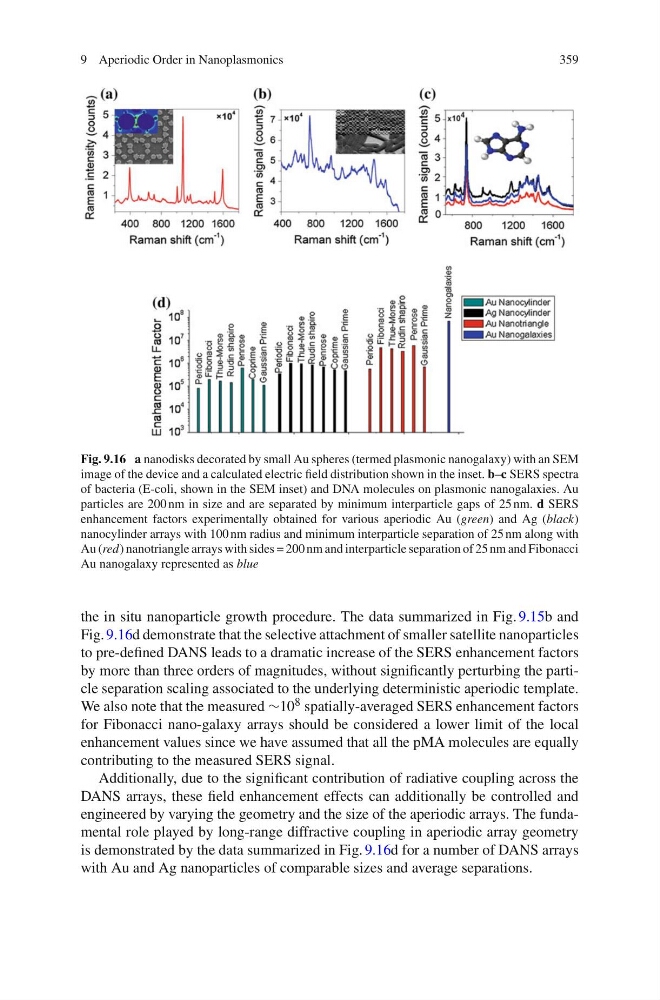
Fig. 9.16 a nanodisks decorated by small Au spheres (termed plasmonic nanogalaxy) with an SEM
image of the device and a calculated electric field distribution shown in the inset. b–c SERS spectra
of bacteria (E-coli, shown in the SEM inset) and DNA molecules on plasmonic nanogalaxies. Au
particles are 200 nm in size and are separated by minimum interparticle gaps of 25 nm. d SERS
enhancement factors experimentally obtained for various aperiodic Au (green) and Ag (black)
nanocylinder arrays with 100 nm radius and minimum interparticle separation of 25 nm along with
Au (red) nanotriangle arrays with sides = 200 nm and interparticle separation of 25 nm and Fibonacci
Au nanogalaxy represented as blue
the in situ nanoparticle growth procedure. The data summarized in Fig. 9.15b and
Fig. 9.16d demonstrate that the selective attachment of smaller satellite nanoparticles
to pre-defined DANS leads to a dramatic increase of the SERS enhancement factors
by more than three orders of magnitudes, without significantly perturbing the particle separation scaling associated to the underlying deterministic aperiodic template.
We also note that the measured ≥10 8 spatially-averaged SERS enhancement factors
for Fibonacci nano-galaxy arrays should be considered a lower limit of the local
enhancement values since we have assumed that all the pMA molecules are equally
contributing to the measured SERS signal.
Additionally, due to the significant contribution of radiative coupling across the
DANS arrays, these field enhancement effects can additionally be controlled and
engineered by varying the geometry and the size of the aperiodic arrays. The fundamental role played by long-range diffractive coupling in aperiodic array geometry
is demonstrated by the data summarized in Fig. 9.16d for a number of DANS arrays
with Au and Ag nanoparticles of comparable sizes and average separations.
359
Fig. 9.16 a nanodisks decorated by small Au spheres (termed plasmonic nanogalaxy) with an SEM
image of the device and a calculated electric field distribution shown in the inset. b–c SERS spectra
of bacteria (E-coli, shown in the SEM inset) and DNA molecules on plasmonic nanogalaxies. Au
particles are 200 nm in size and are separated by minimum interparticle gaps of 25 nm. d SERS
enhancement factors experimentally obtained for various aperiodic Au (green) and Ag (black)
nanocylinder arrays with 100 nm radius and minimum interparticle separation of 25 nm along with
Au (red) nanotriangle arrays with sides = 200 nm and interparticle separation of 25 nm and Fibonacci
Au nanogalaxy represented as blue
the in situ nanoparticle growth procedure. The data summarized in Fig. 9.15b and
Fig. 9.16d demonstrate that the selective attachment of smaller satellite nanoparticles
to pre-defined DANS leads to a dramatic increase of the SERS enhancement factors
by more than three orders of magnitudes, without significantly perturbing the particle separation scaling associated to the underlying deterministic aperiodic template.
We also note that the measured ≥10 8 spatially-averaged SERS enhancement factors
for Fibonacci nano-galaxy arrays should be considered a lower limit of the local
enhancement values since we have assumed that all the pMA molecules are equally
contributing to the measured SERS signal.
Additionally, due to the significant contribution of radiative coupling across the
DANS arrays, these field enhancement effects can additionally be controlled and
engineered by varying the geometry and the size of the aperiodic arrays. The fundamental role played by long-range diffractive coupling in aperiodic array geometry
is demonstrated by the data summarized in Fig. 9.16d for a number of DANS arrays
with Au and Ag nanoparticles of comparable sizes and average separations.